P1YP5YP1Y2013-11-05P1MP2YP15YfalseFY0001578732P3YP6Mhave completed one month of service.P1YP1YP5YP5YP1YP1YReclassification from other assets current. 0001578732 2021-01-01 2021-12-31 0001578732 2020-01-01 2020-12-31 0001578732 2019-01-01 2019-12-31 0001578732 2021-12-31 0001578732 2020-12-31 0001578732 2021-06-30 0001578732 2022-02-15 0001578732 2018-12-31 0001578732 2019-12-31 0001578732 us-gaap:ShortTermInvestmentsMember 2021-12-31 0001578732 mmi:LongTermInvestmentsMember us-gaap:USTreasurySecuritiesMember 2021-12-31 0001578732 mmi:LongTermInvestmentsMember us-gaap:USGovernmentSponsoredEnterprisesDebtSecuritiesMember 2021-12-31 0001578732 mmi:LongTermInvestmentsMember us-gaap:CorporateDebtSecuritiesMember 2021-12-31 0001578732 us-gaap:AssetBackedSecuritiesMember mmi:LongTermInvestmentsMember 2021-12-31 0001578732 mmi:LongTermInvestmentsMember 2021-12-31 0001578732 us-gaap:CorporateDebtSecuritiesMember us-gaap:ShortTermInvestmentsMember 2021-12-31 0001578732 us-gaap:USTreasurySecuritiesMember us-gaap:ShortTermInvestmentsMember 2021-12-31 0001578732 mmi:MortgageServicingRightsMember 2021-12-31 0001578732 us-gaap:FairValueInputsLevel3Member us-gaap:FairValueMeasurementsRecurringMember mmi:InvestmentsHeldInRabbiTrustMember 2021-12-31 0001578732 mmi:InvestmentsHeldInRabbiTrustMember us-gaap:FairValueInputsLevel2Member us-gaap:FairValueMeasurementsRecurringMember 2021-12-31 0001578732 mmi:InvestmentsHeldInRabbiTrustMember us-gaap:FairValueInputsLevel1Member us-gaap:FairValueMeasurementsRecurringMember 2021-12-31 0001578732 mmi:InvestmentsHeldInRabbiTrustMember us-gaap:FairValueMeasurementsRecurringMember 2021-12-31 0001578732 mmi:AccountsPayableAndOtherLiabilitiesCurrentMember 2021-12-31 0001578732 us-gaap:MoneyMarketFundsMember us-gaap:FairValueMeasurementsRecurringMember 2021-12-31 0001578732 us-gaap:MoneyMarketFundsMember us-gaap:FairValueInputsLevel1Member us-gaap:FairValueMeasurementsRecurringMember 2021-12-31 0001578732 us-gaap:FairValueMeasurementsRecurringMember us-gaap:FairValueInputsLevel2Member us-gaap:MoneyMarketFundsMember 2021-12-31 0001578732 us-gaap:MoneyMarketFundsMember us-gaap:FairValueInputsLevel3Member us-gaap:FairValueMeasurementsRecurringMember 2021-12-31 0001578732 us-gaap:FairValueMeasurementsRecurringMember 2021-12-31 0001578732 us-gaap:FairValueInputsLevel1Member us-gaap:FairValueMeasurementsRecurringMember 2021-12-31 0001578732 us-gaap:FairValueInputsLevel2Member us-gaap:FairValueMeasurementsRecurringMember 2021-12-31 0001578732 us-gaap:FairValueInputsLevel3Member us-gaap:FairValueMeasurementsRecurringMember 2021-12-31 0001578732 us-gaap:FairValueInputsLevel3Member us-gaap:FairValueMeasurementsRecurringMember us-gaap:CommercialPaperMember 2021-12-31 0001578732 us-gaap:CommercialPaperMember us-gaap:FairValueInputsLevel2Member us-gaap:FairValueMeasurementsRecurringMember 2021-12-31 0001578732 us-gaap:CommercialPaperMember us-gaap:FairValueInputsLevel1Member us-gaap:FairValueMeasurementsRecurringMember 2021-12-31 0001578732 us-gaap:CommercialPaperMember us-gaap:FairValueMeasurementsRecurringMember 2021-12-31 0001578732 us-gaap:USTreasurySecuritiesMember 2021-12-31 0001578732 us-gaap:USGovernmentSponsoredEnterprisesDebtSecuritiesMember 2021-12-31 0001578732 us-gaap:CorporateDebtSecuritiesMember 2021-12-31 0001578732 us-gaap:AssetBackedSecuritiesMember 2021-12-31 0001578732 us-gaap:FurnitureAndFixturesMember 2021-12-31 0001578732 us-gaap:ComputerEquipmentMember 2021-12-31 0001578732 us-gaap:USTreasurySecuritiesMember us-gaap:FairValueMeasurementsRecurringMember us-gaap:ShortTermInvestmentsMember 2021-12-31 0001578732 us-gaap:USTreasurySecuritiesMember us-gaap:FairValueInputsLevel1Member us-gaap:FairValueMeasurementsRecurringMember us-gaap:ShortTermInvestmentsMember 2021-12-31 0001578732 us-gaap:ShortTermInvestmentsMember us-gaap:FairValueMeasurementsRecurringMember us-gaap:FairValueInputsLevel2Member us-gaap:USTreasurySecuritiesMember 2021-12-31 0001578732 us-gaap:USTreasurySecuritiesMember us-gaap:FairValueInputsLevel3Member us-gaap:FairValueMeasurementsRecurringMember us-gaap:ShortTermInvestmentsMember 2021-12-31 0001578732 us-gaap:ShortTermInvestmentsMember us-gaap:FairValueMeasurementsRecurringMember us-gaap:USGovernmentSponsoredEnterprisesDebtSecuritiesMember 2021-12-31 0001578732 us-gaap:USGovernmentSponsoredEnterprisesDebtSecuritiesMember us-gaap:FairValueInputsLevel1Member us-gaap:FairValueMeasurementsRecurringMember us-gaap:ShortTermInvestmentsMember 2021-12-31 0001578732 us-gaap:USGovernmentSponsoredEnterprisesDebtSecuritiesMember us-gaap:FairValueInputsLevel2Member us-gaap:FairValueMeasurementsRecurringMember us-gaap:ShortTermInvestmentsMember 2021-12-31 0001578732 us-gaap:ShortTermInvestmentsMember us-gaap:FairValueMeasurementsRecurringMember us-gaap:FairValueInputsLevel3Member us-gaap:USGovernmentSponsoredEnterprisesDebtSecuritiesMember 2021-12-31 0001578732 us-gaap:CorporateDebtSecuritiesMember us-gaap:FairValueMeasurementsRecurringMember us-gaap:ShortTermInvestmentsMember 2021-12-31 0001578732 us-gaap:CorporateDebtSecuritiesMember us-gaap:FairValueInputsLevel1Member us-gaap:FairValueMeasurementsRecurringMember us-gaap:ShortTermInvestmentsMember 2021-12-31 0001578732 us-gaap:CorporateDebtSecuritiesMember us-gaap:FairValueInputsLevel2Member us-gaap:FairValueMeasurementsRecurringMember us-gaap:ShortTermInvestmentsMember 2021-12-31 0001578732 us-gaap:CorporateDebtSecuritiesMember us-gaap:FairValueInputsLevel3Member us-gaap:FairValueMeasurementsRecurringMember us-gaap:ShortTermInvestmentsMember 2021-12-31 0001578732 us-gaap:FairValueMeasurementsRecurringMember us-gaap:ShortTermInvestmentsMember 2021-12-31 0001578732 us-gaap:ShortTermInvestmentsMember us-gaap:FairValueMeasurementsRecurringMember us-gaap:FairValueInputsLevel1Member 2021-12-31 0001578732 us-gaap:FairValueMeasurementsRecurringMember us-gaap:FairValueInputsLevel2Member us-gaap:ShortTermInvestmentsMember 2021-12-31 0001578732 us-gaap:FairValueInputsLevel3Member us-gaap:FairValueMeasurementsRecurringMember us-gaap:ShortTermInvestmentsMember 2021-12-31 0001578732 us-gaap:AssetBackedSecuritiesMember mmi:LongTermInvestmentsMember us-gaap:FairValueMeasurementsRecurringMember 2021-12-31 0001578732 us-gaap:AssetBackedSecuritiesMember mmi:LongTermInvestmentsMember us-gaap:FairValueInputsLevel1Member us-gaap:FairValueMeasurementsRecurringMember 2021-12-31 0001578732 us-gaap:AssetBackedSecuritiesMember mmi:LongTermInvestmentsMember us-gaap:FairValueInputsLevel2Member us-gaap:FairValueMeasurementsRecurringMember 2021-12-31 0001578732 us-gaap:AssetBackedSecuritiesMember mmi:LongTermInvestmentsMember us-gaap:FairValueInputsLevel3Member us-gaap:FairValueMeasurementsRecurringMember 2021-12-31 0001578732 us-gaap:USTreasurySecuritiesMember mmi:LongTermInvestmentsMember us-gaap:FairValueMeasurementsRecurringMember 2021-12-31 0001578732 mmi:LongTermInvestmentsMember us-gaap:USGovernmentSponsoredEnterprisesDebtSecuritiesMember us-gaap:FairValueMeasurementsRecurringMember 2021-12-31 0001578732 us-gaap:FairValueMeasurementsRecurringMember us-gaap:CorporateDebtSecuritiesMember mmi:LongTermInvestmentsMember 2021-12-31 0001578732 us-gaap:USTreasurySecuritiesMember mmi:LongTermInvestmentsMember us-gaap:FairValueMeasurementsRecurringMember us-gaap:FairValueInputsLevel1Member 2021-12-31 0001578732 mmi:LongTermInvestmentsMember us-gaap:USGovernmentSponsoredEnterprisesDebtSecuritiesMember us-gaap:FairValueMeasurementsRecurringMember us-gaap:FairValueInputsLevel1Member 2021-12-31 0001578732 mmi:LongTermInvestmentsMember us-gaap:CorporateDebtSecuritiesMember us-gaap:FairValueMeasurementsRecurringMember us-gaap:FairValueInputsLevel1Member 2021-12-31 0001578732 us-gaap:USTreasurySecuritiesMember mmi:LongTermInvestmentsMember us-gaap:FairValueMeasurementsRecurringMember us-gaap:FairValueInputsLevel2Member 2021-12-31 0001578732 mmi:LongTermInvestmentsMember us-gaap:USGovernmentSponsoredEnterprisesDebtSecuritiesMember us-gaap:FairValueMeasurementsRecurringMember us-gaap:FairValueInputsLevel2Member 2021-12-31 0001578732 us-gaap:FairValueInputsLevel2Member us-gaap:FairValueMeasurementsRecurringMember us-gaap:CorporateDebtSecuritiesMember mmi:LongTermInvestmentsMember 2021-12-31 0001578732 us-gaap:USTreasurySecuritiesMember mmi:LongTermInvestmentsMember us-gaap:FairValueMeasurementsRecurringMember us-gaap:FairValueInputsLevel3Member 2021-12-31 0001578732 mmi:LongTermInvestmentsMember us-gaap:USGovernmentSponsoredEnterprisesDebtSecuritiesMember us-gaap:FairValueMeasurementsRecurringMember us-gaap:FairValueInputsLevel3Member 2021-12-31 0001578732 mmi:LongTermInvestmentsMember us-gaap:CorporateDebtSecuritiesMember us-gaap:FairValueMeasurementsRecurringMember us-gaap:FairValueInputsLevel3Member 2021-12-31 0001578732 us-gaap:FairValueMeasurementsRecurringMember mmi:LongTermInvestmentsMember 2021-12-31 0001578732 us-gaap:FairValueMeasurementsRecurringMember mmi:LongTermInvestmentsMember us-gaap:FairValueInputsLevel1Member 2021-12-31 0001578732 us-gaap:FairValueMeasurementsRecurringMember mmi:LongTermInvestmentsMember us-gaap:FairValueInputsLevel3Member 2021-12-31 0001578732 mmi:LongTermInvestmentsMember us-gaap:FairValueInputsLevel2Member us-gaap:FairValueMeasurementsRecurringMember 2021-12-31 0001578732 mmi:TwoThousandAndThirteenOmnibusEquityAwardPlanMember us-gaap:StockOptionMember 2021-12-31 0001578732 mmi:TwoThousandAndThirteenOmnibusEquityAwardPlanMember us-gaap:StockAppreciationRightsSARSMember 2021-12-31 0001578732 us-gaap:PerformanceSharesMember mmi:TwoThousandAndThirteenOmnibusEquityAwardPlanMember 2021-12-31 0001578732 mmi:TwoThousandAndThirteenOmnibusEquityAwardPlanMember mmi:PerformanceUnitsMember 2021-12-31 0001578732 mmi:ContingentConsiderationMember 2021-12-31 0001578732 mmi:ContingentConsiderationMember us-gaap:FairValueInputsLevel1Member us-gaap:FairValueMeasurementsRecurringMember 2021-12-31 0001578732 mmi:ContingentConsiderationMember us-gaap:FairValueInputsLevel2Member us-gaap:FairValueMeasurementsRecurringMember 2021-12-31 0001578732 mmi:ContingentConsiderationMember us-gaap:FairValueInputsLevel3Member 2021-12-31 0001578732 mmi:MarcusAndMillichapCompanyMember 2021-12-31 0001578732 mmi:CustomerTrustAccountsAndOtherMember 2021-12-31 0001578732 mmi:EmployeeNotesReceivableMember 2021-12-31 0001578732 mmi:SecurityDepositMember 2021-12-31 0001578732 mmi:MortgageServicingRightsNetOfAmortizationMember 2021-12-31 0001578732 us-gaap:HeldtomaturitySecuritiesMember 2021-12-31 0001578732 mmi:EmployeeStockPurchasePlanMember 2021-12-31 0001578732 us-gaap:RestrictedStockUnitsRSUMember mmi:IndependentContractorsMember 2021-12-31 0001578732 us-gaap:RestrictedStockUnitsRSUMember us-gaap:EmployeeStockMember 2021-12-31 0001578732 us-gaap:RestrictedStockMember mmi:NonEmployeeDirectorMember 2021-12-31 0001578732 us-gaap:FairValueInputsLevel3Member mmi:ContingentConsiderationMember us-gaap:ValuationTechniqueDiscountedCashFlowMember us-gaap:FairValueMeasurementsRecurringMember 2021-12-31 0001578732 us-gaap:FairValueInputsLevel3Member us-gaap:FairValueMeasurementsRecurringMember mmi:ContingentConsiderationMember us-gaap:MeasurementInputExpectedTermMember srt:MinimumMember 2021-12-31 0001578732 us-gaap:FairValueInputsLevel3Member us-gaap:FairValueMeasurementsRecurringMember mmi:ContingentConsiderationMember us-gaap:MeasurementInputExpectedTermMember srt:MaximumMember 2021-12-31 0001578732 us-gaap:FairValueInputsLevel3Member mmi:ContingentConsiderationMember us-gaap:FairValueMeasurementsRecurringMember us-gaap:MeasurementInputExpectedTermMember srt:WeightedAverageMember 2021-12-31 0001578732 us-gaap:FairValueInputsLevel3Member us-gaap:FairValueMeasurementsRecurringMember mmi:ContingentConsiderationMember srt:MinimumMember us-gaap:MeasurementInputDiscountRateMember 2021-12-31 0001578732 srt:MaximumMember us-gaap:MeasurementInputDiscountRateMember mmi:ContingentConsiderationMember us-gaap:FairValueMeasurementsRecurringMember us-gaap:FairValueInputsLevel3Member 2021-12-31 0001578732 us-gaap:FairValueInputsLevel3Member us-gaap:FairValueMeasurementsRecurringMember mmi:ContingentConsiderationMember srt:WeightedAverageMember us-gaap:MeasurementInputDiscountRateMember 2021-12-31 0001578732 us-gaap:FairValueInputsLevel3Member us-gaap:FairValueMeasurementsRecurringMember mmi:ContingentConsiderationMember mmi:ProbabilityOfAchievementMember srt:MinimumMember 2021-12-31 0001578732 srt:MaximumMember mmi:ProbabilityOfAchievementMember mmi:ContingentConsiderationMember us-gaap:FairValueMeasurementsRecurringMember us-gaap:FairValueInputsLevel3Member 2021-12-31 0001578732 us-gaap:FairValueInputsLevel3Member us-gaap:FairValueMeasurementsRecurringMember mmi:ContingentConsiderationMember mmi:ProbabilityOfAchievementMember srt:WeightedAverageMember 2021-12-31 0001578732 us-gaap:FairValueInputsLevel3Member mmi:MortgageRightsMember us-gaap:FairValueMeasurementsNonrecurringMember us-gaap:ValuationTechniqueDiscountedCashFlowMember 2021-12-31 0001578732 mmi:MortgageRightsMember us-gaap:FairValueInputsLevel3Member us-gaap:FairValueMeasurementsNonrecurringMember us-gaap:MeasurementInputPrepaymentRateMember srt:MinimumMember 2021-12-31 0001578732 mmi:MortgageRightsMember us-gaap:FairValueInputsLevel3Member us-gaap:FairValueMeasurementsNonrecurringMember us-gaap:MeasurementInputPrepaymentRateMember srt:MaximumMember 2021-12-31 0001578732 srt:MinimumMember us-gaap:MeasurementInputDefaultRateMember us-gaap:FairValueMeasurementsNonrecurringMember us-gaap:FairValueInputsLevel3Member mmi:MortgageRightsMember 2021-12-31 0001578732 mmi:MortgageRightsMember us-gaap:FairValueInputsLevel3Member us-gaap:FairValueMeasurementsNonrecurringMember us-gaap:MeasurementInputDefaultRateMember srt:MaximumMember 2021-12-31 0001578732 mmi:MortgageRightsMember us-gaap:FairValueInputsLevel3Member us-gaap:FairValueMeasurementsNonrecurringMember us-gaap:MeasurementInputLossSeverityMember srt:MinimumMember 2021-12-31 0001578732 srt:MaximumMember us-gaap:MeasurementInputLossSeverityMember us-gaap:FairValueMeasurementsNonrecurringMember us-gaap:FairValueInputsLevel3Member mmi:MortgageRightsMember 2021-12-31 0001578732 mmi:MortgageRightsMember us-gaap:FairValueInputsLevel3Member us-gaap:FairValueMeasurementsNonrecurringMember us-gaap:MeasurementInputDiscountRateMember srt:MinimumMember 2021-12-31 0001578732 mmi:MortgageRightsMember us-gaap:FairValueInputsLevel3Member us-gaap:FairValueMeasurementsNonrecurringMember us-gaap:MeasurementInputDiscountRateMember srt:MaximumMember 2021-12-31 0001578732 srt:WeightedAverageMember us-gaap:MeasurementInputPrepaymentRateMember mmi:MortgageRightsMember us-gaap:FairValueInputsLevel3Member us-gaap:FairValueMeasurementsNonrecurringMember 2021-12-31 0001578732 srt:WeightedAverageMember us-gaap:MeasurementInputDefaultRateMember mmi:MortgageRightsMember us-gaap:FairValueInputsLevel3Member us-gaap:FairValueMeasurementsNonrecurringMember 2021-12-31 0001578732 srt:WeightedAverageMember us-gaap:MeasurementInputLossSeverityMember mmi:MortgageRightsMember us-gaap:FairValueInputsLevel3Member us-gaap:FairValueMeasurementsNonrecurringMember 2021-12-31 0001578732 us-gaap:FairValueMeasurementsNonrecurringMember us-gaap:FairValueInputsLevel3Member mmi:MortgageRightsMember us-gaap:MeasurementInputDiscountRateMember srt:WeightedAverageMember 2021-12-31 0001578732 us-gaap:MeasurementInputConstantPrepaymentRateMember 2021-12-31 0001578732 mmi:CreditAgreementMember 2021-12-31 0001578732 mmi:WeightedAverageCreditAaPlusRatingMember srt:StandardPoorsAAPlusRatingMember srt:MoodysAa3RatingMember srt:FitchAAPlusRatingMember 2021-12-31 0001578732 mmi:TwoThousandAndThirteenOmnibusEquityAwardPlanMember mmi:DeferredStockUnitsMember 2021-12-31 0001578732 us-gaap:USTreasurySecuritiesMember us-gaap:ShortTermInvestmentsMember 2020-12-31 0001578732 us-gaap:ShortTermInvestmentsMember us-gaap:USGovernmentSponsoredEnterprisesDebtSecuritiesMember 2020-12-31 0001578732 us-gaap:CorporateDebtSecuritiesMember us-gaap:ShortTermInvestmentsMember 2020-12-31 0001578732 us-gaap:ShortTermInvestmentsMember 2020-12-31 0001578732 us-gaap:USTreasurySecuritiesMember mmi:LongTermInvestmentsMember 2020-12-31 0001578732 us-gaap:USGovernmentSponsoredEnterprisesDebtSecuritiesMember mmi:LongTermInvestmentsMember 2020-12-31 0001578732 us-gaap:CorporateDebtSecuritiesMember mmi:LongTermInvestmentsMember 2020-12-31 0001578732 mmi:LongTermInvestmentsMember us-gaap:AssetBackedSecuritiesMember 2020-12-31 0001578732 mmi:LongTermInvestmentsMember 2020-12-31 0001578732 mmi:MortgageServicingRightsMember 2020-12-31 0001578732 mmi:InvestmentsHeldInRabbiTrustMember us-gaap:FairValueInputsLevel3Member us-gaap:FairValueMeasurementsRecurringMember 2020-12-31 0001578732 mmi:InvestmentsHeldInRabbiTrustMember us-gaap:FairValueInputsLevel2Member us-gaap:FairValueMeasurementsRecurringMember 2020-12-31 0001578732 us-gaap:FairValueInputsLevel1Member us-gaap:FairValueMeasurementsRecurringMember mmi:InvestmentsHeldInRabbiTrustMember 2020-12-31 0001578732 mmi:InvestmentsHeldInRabbiTrustMember us-gaap:FairValueMeasurementsRecurringMember 2020-12-31 0001578732 mmi:AccountsPayableAndOtherLiabilitiesCurrentMember 2020-12-31 0001578732 us-gaap:FairValueMeasurementsRecurringMember us-gaap:FairValueInputsLevel3Member us-gaap:CommercialPaperMember 2020-12-31 0001578732 us-gaap:MoneyMarketFundsMember us-gaap:FairValueMeasurementsRecurringMember 2020-12-31 0001578732 us-gaap:MoneyMarketFundsMember us-gaap:FairValueInputsLevel1Member us-gaap:FairValueMeasurementsRecurringMember 2020-12-31 0001578732 us-gaap:MoneyMarketFundsMember us-gaap:FairValueMeasurementsRecurringMember us-gaap:FairValueInputsLevel2Member 2020-12-31 0001578732 us-gaap:FairValueMeasurementsRecurringMember us-gaap:FairValueInputsLevel3Member us-gaap:MoneyMarketFundsMember 2020-12-31 0001578732 us-gaap:FairValueMeasurementsRecurringMember 2020-12-31 0001578732 us-gaap:FairValueInputsLevel1Member us-gaap:FairValueMeasurementsRecurringMember 2020-12-31 0001578732 us-gaap:FairValueMeasurementsRecurringMember us-gaap:FairValueInputsLevel2Member 2020-12-31 0001578732 us-gaap:FairValueMeasurementsRecurringMember us-gaap:FairValueInputsLevel3Member 2020-12-31 0001578732 us-gaap:CommercialPaperMember us-gaap:FairValueInputsLevel2Member us-gaap:FairValueMeasurementsRecurringMember 2020-12-31 0001578732 us-gaap:FairValueMeasurementsRecurringMember us-gaap:FairValueInputsLevel1Member us-gaap:CommercialPaperMember 2020-12-31 0001578732 us-gaap:CommercialPaperMember us-gaap:FairValueMeasurementsRecurringMember 2020-12-31 0001578732 us-gaap:USTreasurySecuritiesMember 2020-12-31 0001578732 us-gaap:CorporateDebtSecuritiesMember 2020-12-31 0001578732 us-gaap:AssetBackedSecuritiesMember 2020-12-31 0001578732 us-gaap:FurnitureAndFixturesMember 2020-12-31 0001578732 us-gaap:ComputerEquipmentMember 2020-12-31 0001578732 us-gaap:USTreasurySecuritiesMember us-gaap:FairValueMeasurementsRecurringMember us-gaap:ShortTermInvestmentsMember 2020-12-31 0001578732 us-gaap:USTreasurySecuritiesMember us-gaap:FairValueInputsLevel1Member us-gaap:FairValueMeasurementsRecurringMember us-gaap:ShortTermInvestmentsMember 2020-12-31 0001578732 us-gaap:FairValueInputsLevel2Member us-gaap:FairValueMeasurementsRecurringMember us-gaap:USTreasurySecuritiesMember us-gaap:ShortTermInvestmentsMember 2020-12-31 0001578732 us-gaap:FairValueMeasurementsRecurringMember us-gaap:FairValueInputsLevel3Member us-gaap:USTreasurySecuritiesMember us-gaap:ShortTermInvestmentsMember 2020-12-31 0001578732 us-gaap:USGovernmentSponsoredEnterprisesDebtSecuritiesMember us-gaap:FairValueMeasurementsRecurringMember us-gaap:ShortTermInvestmentsMember 2020-12-31 0001578732 us-gaap:FairValueMeasurementsRecurringMember us-gaap:FairValueInputsLevel1Member us-gaap:USGovernmentSponsoredEnterprisesDebtSecuritiesMember us-gaap:ShortTermInvestmentsMember 2020-12-31 0001578732 us-gaap:USGovernmentSponsoredEnterprisesDebtSecuritiesMember us-gaap:FairValueInputsLevel2Member us-gaap:FairValueMeasurementsRecurringMember us-gaap:ShortTermInvestmentsMember 2020-12-31 0001578732 us-gaap:FairValueMeasurementsRecurringMember us-gaap:FairValueInputsLevel3Member us-gaap:USGovernmentSponsoredEnterprisesDebtSecuritiesMember us-gaap:ShortTermInvestmentsMember 2020-12-31 0001578732 us-gaap:CorporateDebtSecuritiesMember us-gaap:FairValueMeasurementsRecurringMember us-gaap:ShortTermInvestmentsMember 2020-12-31 0001578732 us-gaap:FairValueMeasurementsRecurringMember us-gaap:FairValueInputsLevel1Member us-gaap:CorporateDebtSecuritiesMember us-gaap:ShortTermInvestmentsMember 2020-12-31 0001578732 us-gaap:CorporateDebtSecuritiesMember us-gaap:FairValueInputsLevel2Member us-gaap:FairValueMeasurementsRecurringMember us-gaap:ShortTermInvestmentsMember 2020-12-31 0001578732 us-gaap:FairValueMeasurementsRecurringMember us-gaap:FairValueInputsLevel3Member us-gaap:CorporateDebtSecuritiesMember us-gaap:ShortTermInvestmentsMember 2020-12-31 0001578732 us-gaap:FairValueMeasurementsRecurringMember us-gaap:ShortTermInvestmentsMember 2020-12-31 0001578732 us-gaap:FairValueInputsLevel1Member us-gaap:FairValueMeasurementsRecurringMember us-gaap:ShortTermInvestmentsMember 2020-12-31 0001578732 us-gaap:FairValueInputsLevel2Member us-gaap:FairValueMeasurementsRecurringMember us-gaap:ShortTermInvestmentsMember 2020-12-31 0001578732 us-gaap:ShortTermInvestmentsMember us-gaap:FairValueInputsLevel3Member us-gaap:FairValueMeasurementsRecurringMember 2020-12-31 0001578732 us-gaap:AssetBackedSecuritiesMember mmi:LongTermInvestmentsMember us-gaap:FairValueMeasurementsRecurringMember 2020-12-31 0001578732 us-gaap:FairValueMeasurementsRecurringMember us-gaap:FairValueInputsLevel1Member mmi:LongTermInvestmentsMember us-gaap:AssetBackedSecuritiesMember 2020-12-31 0001578732 us-gaap:AssetBackedSecuritiesMember mmi:LongTermInvestmentsMember us-gaap:FairValueInputsLevel2Member us-gaap:FairValueMeasurementsRecurringMember 2020-12-31 0001578732 us-gaap:FairValueMeasurementsRecurringMember us-gaap:FairValueInputsLevel3Member mmi:LongTermInvestmentsMember us-gaap:AssetBackedSecuritiesMember 2020-12-31 0001578732 us-gaap:USTreasurySecuritiesMember mmi:LongTermInvestmentsMember us-gaap:FairValueMeasurementsRecurringMember 2020-12-31 0001578732 mmi:LongTermInvestmentsMember us-gaap:USGovernmentSponsoredEnterprisesDebtSecuritiesMember us-gaap:FairValueMeasurementsRecurringMember 2020-12-31 0001578732 us-gaap:FairValueMeasurementsRecurringMember us-gaap:CorporateDebtSecuritiesMember mmi:LongTermInvestmentsMember 2020-12-31 0001578732 us-gaap:USTreasurySecuritiesMember mmi:LongTermInvestmentsMember us-gaap:FairValueMeasurementsRecurringMember us-gaap:FairValueInputsLevel1Member 2020-12-31 0001578732 mmi:LongTermInvestmentsMember us-gaap:USGovernmentSponsoredEnterprisesDebtSecuritiesMember us-gaap:FairValueMeasurementsRecurringMember us-gaap:FairValueInputsLevel1Member 2020-12-31 0001578732 mmi:LongTermInvestmentsMember us-gaap:CorporateDebtSecuritiesMember us-gaap:FairValueMeasurementsRecurringMember us-gaap:FairValueInputsLevel1Member 2020-12-31 0001578732 mmi:LongTermInvestmentsMember us-gaap:USGovernmentSponsoredEnterprisesDebtSecuritiesMember us-gaap:FairValueMeasurementsRecurringMember us-gaap:FairValueInputsLevel2Member 2020-12-31 0001578732 mmi:LongTermInvestmentsMember us-gaap:CorporateDebtSecuritiesMember us-gaap:FairValueMeasurementsRecurringMember us-gaap:FairValueInputsLevel2Member 2020-12-31 0001578732 us-gaap:USTreasurySecuritiesMember mmi:LongTermInvestmentsMember us-gaap:FairValueMeasurementsRecurringMember us-gaap:FairValueInputsLevel3Member 2020-12-31 0001578732 mmi:LongTermInvestmentsMember us-gaap:USGovernmentSponsoredEnterprisesDebtSecuritiesMember us-gaap:FairValueMeasurementsRecurringMember us-gaap:FairValueInputsLevel3Member 2020-12-31 0001578732 us-gaap:FairValueInputsLevel3Member us-gaap:FairValueMeasurementsRecurringMember us-gaap:CorporateDebtSecuritiesMember mmi:LongTermInvestmentsMember 2020-12-31 0001578732 us-gaap:FairValueMeasurementsRecurringMember mmi:LongTermInvestmentsMember 2020-12-31 0001578732 us-gaap:FairValueMeasurementsRecurringMember mmi:LongTermInvestmentsMember us-gaap:FairValueInputsLevel1Member 2020-12-31 0001578732 us-gaap:FairValueInputsLevel2Member mmi:LongTermInvestmentsMember us-gaap:FairValueMeasurementsRecurringMember 2020-12-31 0001578732 us-gaap:FairValueMeasurementsRecurringMember mmi:LongTermInvestmentsMember us-gaap:FairValueInputsLevel3Member 2020-12-31 0001578732 us-gaap:FairValueInputsLevel2Member us-gaap:FairValueMeasurementsRecurringMember us-gaap:USTreasurySecuritiesMember mmi:LongTermInvestmentsMember 2020-12-31 0001578732 mmi:ContingentConsiderationMember 2020-12-31 0001578732 mmi:ContingentConsiderationMember us-gaap:FairValueInputsLevel1Member us-gaap:FairValueMeasurementsRecurringMember 2020-12-31 0001578732 us-gaap:FairValueMeasurementsRecurringMember us-gaap:FairValueInputsLevel2Member mmi:ContingentConsiderationMember 2020-12-31 0001578732 mmi:ContingentConsiderationMember us-gaap:FairValueInputsLevel3Member 2020-12-31 0001578732 mmi:MarcusAndMillichapCompanyMember 2020-12-31 0001578732 mmi:CustomerTrustAccountsAndOtherMember 2020-12-31 0001578732 mmi:EmployeeNotesReceivableMember 2020-12-31 0001578732 mmi:SecurityDepositMember 2020-12-31 0001578732 mmi:MortgageServicingRightsNetOfAmortizationMember 2020-12-31 0001578732 us-gaap:HeldtomaturitySecuritiesMember 2020-12-31 0001578732 us-gaap:FairValueInputsLevel3Member mmi:ContingentConsiderationMember us-gaap:ValuationTechniqueDiscountedCashFlowMember us-gaap:FairValueMeasurementsRecurringMember 2020-12-31 0001578732 us-gaap:FairValueInputsLevel3Member us-gaap:FairValueMeasurementsRecurringMember mmi:ContingentConsiderationMember us-gaap:MeasurementInputExpectedTermMember srt:MinimumMember 2020-12-31 0001578732 us-gaap:FairValueInputsLevel3Member us-gaap:FairValueMeasurementsRecurringMember mmi:ContingentConsiderationMember us-gaap:MeasurementInputExpectedTermMember srt:MaximumMember 2020-12-31 0001578732 us-gaap:FairValueInputsLevel3Member us-gaap:FairValueMeasurementsRecurringMember mmi:ContingentConsiderationMember us-gaap:MeasurementInputExpectedTermMember srt:WeightedAverageMember 2020-12-31 0001578732 us-gaap:FairValueInputsLevel3Member us-gaap:FairValueMeasurementsRecurringMember mmi:ContingentConsiderationMember us-gaap:MeasurementInputDiscountRateMember srt:MinimumMember 2020-12-31 0001578732 us-gaap:FairValueInputsLevel3Member us-gaap:FairValueMeasurementsRecurringMember mmi:ContingentConsiderationMember us-gaap:MeasurementInputDiscountRateMember srt:MaximumMember 2020-12-31 0001578732 us-gaap:FairValueInputsLevel3Member us-gaap:FairValueMeasurementsRecurringMember mmi:ContingentConsiderationMember us-gaap:MeasurementInputDiscountRateMember srt:WeightedAverageMember 2020-12-31 0001578732 srt:MinimumMember mmi:ProbabilityOfAchievementMember mmi:ContingentConsiderationMember us-gaap:FairValueMeasurementsRecurringMember us-gaap:FairValueInputsLevel3Member 2020-12-31 0001578732 us-gaap:FairValueInputsLevel3Member us-gaap:FairValueMeasurementsRecurringMember mmi:ContingentConsiderationMember mmi:ProbabilityOfAchievementMember srt:MaximumMember 2020-12-31 0001578732 us-gaap:FairValueInputsLevel3Member us-gaap:FairValueMeasurementsRecurringMember mmi:ContingentConsiderationMember mmi:ProbabilityOfAchievementMember srt:WeightedAverageMember 2020-12-31 0001578732 us-gaap:FairValueInputsLevel3Member mmi:MortgageRightsMember us-gaap:FairValueMeasurementsNonrecurringMember us-gaap:ValuationTechniqueDiscountedCashFlowMember 2020-12-31 0001578732 mmi:MortgageRightsMember us-gaap:FairValueInputsLevel3Member us-gaap:FairValueMeasurementsNonrecurringMember us-gaap:MeasurementInputPrepaymentRateMember srt:MinimumMember 2020-12-31 0001578732 mmi:MortgageRightsMember us-gaap:FairValueInputsLevel3Member us-gaap:FairValueMeasurementsNonrecurringMember us-gaap:MeasurementInputPrepaymentRateMember srt:MaximumMember 2020-12-31 0001578732 mmi:MortgageRightsMember us-gaap:FairValueInputsLevel3Member us-gaap:FairValueMeasurementsNonrecurringMember us-gaap:MeasurementInputDefaultRateMember srt:MinimumMember 2020-12-31 0001578732 srt:MaximumMember us-gaap:MeasurementInputDefaultRateMember us-gaap:FairValueMeasurementsNonrecurringMember us-gaap:FairValueInputsLevel3Member mmi:MortgageRightsMember 2020-12-31 0001578732 mmi:MortgageRightsMember us-gaap:FairValueInputsLevel3Member us-gaap:FairValueMeasurementsNonrecurringMember us-gaap:MeasurementInputLossSeverityMember srt:MinimumMember 2020-12-31 0001578732 mmi:MortgageRightsMember us-gaap:FairValueInputsLevel3Member us-gaap:FairValueMeasurementsNonrecurringMember us-gaap:MeasurementInputLossSeverityMember srt:MaximumMember 2020-12-31 0001578732 mmi:MortgageRightsMember us-gaap:FairValueInputsLevel3Member us-gaap:FairValueMeasurementsNonrecurringMember us-gaap:MeasurementInputDiscountRateMember srt:MinimumMember 2020-12-31 0001578732 mmi:MortgageRightsMember us-gaap:FairValueInputsLevel3Member us-gaap:FairValueMeasurementsNonrecurringMember us-gaap:MeasurementInputDiscountRateMember srt:MaximumMember 2020-12-31 0001578732 mmi:MortgageRightsMember us-gaap:FairValueInputsLevel3Member us-gaap:FairValueMeasurementsNonrecurringMember us-gaap:MeasurementInputPrepaymentRateMember srt:WeightedAverageMember 2020-12-31 0001578732 mmi:MortgageRightsMember us-gaap:FairValueInputsLevel3Member us-gaap:FairValueMeasurementsNonrecurringMember us-gaap:MeasurementInputDefaultRateMember srt:WeightedAverageMember 2020-12-31 0001578732 mmi:MortgageRightsMember us-gaap:FairValueInputsLevel3Member us-gaap:FairValueMeasurementsNonrecurringMember us-gaap:MeasurementInputLossSeverityMember srt:WeightedAverageMember 2020-12-31 0001578732 mmi:MortgageRightsMember us-gaap:FairValueInputsLevel3Member us-gaap:FairValueMeasurementsNonrecurringMember us-gaap:MeasurementInputDiscountRateMember srt:WeightedAverageMember 2020-12-31 0001578732 us-gaap:MeasurementInputConstantPrepaymentRateMember 2020-12-31 0001578732 us-gaap:SalesRevenueNetMember us-gaap:CustomerConcentrationRiskMember mmi:CustomerMember 2021-01-01 2021-12-31 0001578732 srt:MaximumMember us-gaap:GeographicConcentrationRiskMember us-gaap:SalesRevenueNetMember country:CA mmi:CustomerMember 2021-01-01 2021-12-31 0001578732 mmi:CustomerMember us-gaap:SalesRevenueNetMember us-gaap:GeographicConcentrationRiskMember 2021-01-01 2021-12-31 0001578732 mmi:TransactionRiskMember mmi:CustomerMember us-gaap:SalesRevenueNetMember 2021-01-01 2021-12-31 0001578732 us-gaap:CustomerConcentrationRiskMember mmi:CommissionReceivableMember mmi:CustomerMember 2021-01-01 2021-12-31 0001578732 mmi:MarcusAndMillichapCompanyMember mmi:TransitionServicesAgreementMember 2021-01-01 2021-12-31 0001578732 mmi:TwoThousandAndThirteenOmnibusEquityAwardPlanMember us-gaap:RestrictedStockMember 2021-01-01 2021-12-31 0001578732 mmi:TwoThousandAndThirteenOmnibusEquityAwardPlanMember us-gaap:RestrictedStockUnitsRSUMember 2021-01-01 2021-12-31 0001578732 mmi:EmployeeStockPurchasePlanMember 2021-01-01 2021-12-31 0001578732 mmi:TwoThousandAndThirteenOmnibusEquityAwardPlanMember us-gaap:StockOptionMember 2021-01-01 2021-12-31 0001578732 mmi:TwoThousandAndThirteenOmnibusEquityAwardPlanMember us-gaap:StockAppreciationRightsSARSMember 2021-01-01 2021-12-31 0001578732 mmi:TwoThousandAndThirteenOmnibusEquityAwardPlanMember mmi:PerformanceUnitsMember 2021-01-01 2021-12-31 0001578732 mmi:TwoThousandAndThirteenOmnibusEquityAwardPlanMember us-gaap:PerformanceSharesMember 2021-01-01 2021-12-31 0001578732 mmi:MarcusAndMillichapCompanyMember 2021-01-01 2021-12-31 0001578732 us-gaap:SalesRevenueNetMember us-gaap:GeographicConcentrationRiskMember 2021-01-01 2021-12-31 0001578732 mmi:ContingentConsiderationMember 2021-01-01 2021-12-31 0001578732 mmi:TwoThousandAndThirteenOmnibusEquityAwardPlanMember mmi:DeferredStockUnitsMemberMember 2021-01-01 2021-12-31 0001578732 us-gaap:StockAppreciationRightsSARSMember 2021-01-01 2021-12-31 0001578732 mmi:IpoMmiMember 2021-01-01 2021-12-31 0001578732 us-gaap:RestrictedStockMember mmi:NonEmployeeDirectorMember 2021-01-01 2021-12-31 0001578732 us-gaap:EmployeeStockMember us-gaap:RestrictedStockUnitsRSUMember 2021-01-01 2021-12-31 0001578732 us-gaap:RestrictedStockUnitsRSUMember mmi:IndependentContractorsSubsequentToAdoptionOfNewStandardMember 2021-01-01 2021-12-31 0001578732 us-gaap:RestrictedStockUnitsRSUMember mmi:IndependentContractorsMember 2021-01-01 2021-12-31 0001578732 mmi:TwoThousandAndThirteenOmnibusEquityAwardPlanMember mmi:RestrictedStockAndDeferredStockUnitsMember 2021-01-01 2021-12-31 0001578732 mmi:CreditAgreementMember 2021-01-01 2021-12-31 0001578732 us-gaap:PreferredStockMember 2021-01-01 2021-12-31 0001578732 us-gaap:CommonStockMember 2021-01-01 2021-12-31 0001578732 us-gaap:AdditionalPaidInCapitalMember 2021-01-01 2021-12-31 0001578732 us-gaap:ReceivablesFromStockholderMember 2021-01-01 2021-12-31 0001578732 us-gaap:RetainedEarningsMember 2021-01-01 2021-12-31 0001578732 us-gaap:AccumulatedOtherComprehensiveIncomeMember 2021-01-01 2021-12-31 0001578732 mmi:FinancingFeesMember 2021-01-01 2021-12-31 0001578732 mmi:OtherRevenuesMember 2021-01-01 2021-12-31 0001578732 mmi:RealEstateBrokerageCommissionsMember 2021-01-01 2021-12-31 0001578732 mmi:ChairmanAndFounderMember 2021-01-01 2021-12-31 0001578732 mmi:EmployeeStockPurchasePlanAnnualAvailableForIssuanceShareIncreaseMember 2021-01-01 2021-12-31 0001578732 us-gaap:LondonInterbankOfferedRateLIBORMember srt:MaximumMember 2021-01-01 2021-12-31 0001578732 us-gaap:LondonInterbankOfferedRateLIBORMember srt:MinimumMember 2021-01-01 2021-12-31 0001578732 mmi:FederalFundsRateMember 2021-01-01 2021-12-31 0001578732 us-gaap:LondonInterbankOfferedRateLIBORMember 2021-01-01 2021-12-31 0001578732 mmi:CommissionsPayableMember 2021-01-01 2021-12-31 0001578732 mmi:DeferredCompensationLiabilityMember 2021-01-01 2021-12-31 0001578732 srt:MinimumMember 2021-01-01 2021-12-31 0001578732 srt:MaximumMember 2021-01-01 2021-12-31 0001578732 us-gaap:SoftwareDevelopmentMember 2021-01-01 2021-12-31 0001578732 mmi:ContributionPlanMember 2021-01-01 2021-12-31 0001578732 country:US 2021-01-01 2021-12-31 0001578732 mmi:ForeignMember 2021-01-01 2021-12-31 0001578732 us-gaap:FairValueMeasurementsRecurringMember srt:MinimumMember 2021-01-01 2021-12-31 0001578732 us-gaap:FairValueMeasurementsRecurringMember srt:MaximumMember 2021-01-01 2021-12-31 0001578732 mmi:TwoThousandAndThirteenOmnibusEquityAwardPlanMember mmi:RestrictedStockUnitsAndRestrictedStockAwardsMember 2021-01-01 2021-12-31 0001578732 mmi:MortgageBrokerageBusinessMember 2021-01-01 2021-12-31 0001578732 srt:MaximumMember mmi:AdvancesToInvestmentSalesAndFinancingProfessionalsMember 2021-01-01 2021-12-31 0001578732 mmi:AdvancesToInvestmentSalesAndFinancingProfessionalsMember srt:MinimumMember 2021-01-01 2021-12-31 0001578732 mmi:LoanToInvestmentSalesAndFinancingProfessionalsMember srt:MaximumMember 2021-01-01 2021-12-31 0001578732 mmi:LoanToInvestmentSalesAndFinancingProfessionalsMember srt:MinimumMember 2021-01-01 2021-12-31 0001578732 srt:FitchAARatingMember srt:MoodysAaaRatingMember srt:StandardPoorsAARatingMember 2021-01-01 2021-12-31 0001578732 mmi:ContributionPlanMember us-gaap:ShareBasedCompensationAwardTrancheThreeMember 2021-01-01 2021-12-31 0001578732 mmi:ContributionPlanMember us-gaap:ShareBasedCompensationAwardTrancheTwoMember 2021-01-01 2021-12-31 0001578732 mmi:ContributionPlanMember us-gaap:ShareBasedCompensationAwardTrancheOneMember 2021-01-01 2021-12-31 0001578732 us-gaap:CustomerConcentrationRiskMember mmi:CommissionReceivableMember mmi:CustomerMember 2020-01-01 2020-12-31 0001578732 srt:MaximumMember us-gaap:GeographicConcentrationRiskMember us-gaap:SalesRevenueNetMember country:CA mmi:CustomerMember 2020-01-01 2020-12-31 0001578732 mmi:TransactionRiskMember mmi:CustomerMember us-gaap:SalesRevenueNetMember 2020-01-01 2020-12-31 0001578732 us-gaap:CustomerConcentrationRiskMember us-gaap:SalesRevenueNetMember mmi:CustomerMember 2020-01-01 2020-12-31 0001578732 us-gaap:GeographicConcentrationRiskMember us-gaap:SalesRevenueNetMember mmi:CustomerMember 2020-01-01 2020-12-31 0001578732 mmi:MarcusAndMillichapCompanyMember mmi:TransitionServicesAgreementMember 2020-01-01 2020-12-31 0001578732 mmi:MarcusAndMillichapCompanyMember 2020-01-01 2020-12-31 0001578732 us-gaap:GeographicConcentrationRiskMember us-gaap:SalesRevenueNetMember 2020-01-01 2020-12-31 0001578732 mmi:ContingentConsiderationMember 2020-01-01 2020-12-31 0001578732 mmi:EmployeeStockPurchasePlanMember 2020-01-01 2020-12-31 0001578732 us-gaap:RestrictedStockMember mmi:NonEmployeeDirectorMember 2020-01-01 2020-12-31 0001578732 us-gaap:RestrictedStockUnitsRSUMember us-gaap:EmployeeStockMember 2020-01-01 2020-12-31 0001578732 us-gaap:RestrictedStockUnitsRSUMember mmi:IndependentContractorsSubsequentToAdoptionOfNewStandardMember 2020-01-01 2020-12-31 0001578732 mmi:IndependentContractorsMember us-gaap:RestrictedStockUnitsRSUMember 2020-01-01 2020-12-31 0001578732 us-gaap:PreferredStockMember 2020-01-01 2020-12-31 0001578732 us-gaap:CommonStockMember 2020-01-01 2020-12-31 0001578732 us-gaap:AdditionalPaidInCapitalMember 2020-01-01 2020-12-31 0001578732 us-gaap:ReceivablesFromStockholderMember 2020-01-01 2020-12-31 0001578732 us-gaap:RetainedEarningsMember 2020-01-01 2020-12-31 0001578732 us-gaap:AccumulatedOtherComprehensiveIncomeMember 2020-01-01 2020-12-31 0001578732 mmi:FinancingFeesMember 2020-01-01 2020-12-31 0001578732 mmi:OtherRevenuesMember 2020-01-01 2020-12-31 0001578732 mmi:RealEstateBrokerageCommissionsMember 2020-01-01 2020-12-31 0001578732 us-gaap:StockAppreciationRightsSARSMember 2020-01-01 2020-12-31 0001578732 mmi:CreditAgreementMember 2020-01-01 2020-12-31 0001578732 mmi:DeferredCompensationLiabilityMember 2020-01-01 2020-12-31 0001578732 mmi:ContributionPlanMember 2020-01-01 2020-12-31 0001578732 country:US 2020-01-01 2020-12-31 0001578732 mmi:ForeignMember 2020-01-01 2020-12-31 0001578732 mmi:TwoThousandAndThirteenOmnibusEquityAwardPlanMember mmi:RestrictedStockUnitsAndRestrictedStockAwardsMember 2020-01-01 2020-12-31 0001578732 mmi:TwoThousandAndThirteenOmnibusEquityAwardPlanMember mmi:DeferredStockUnitsMemberMember 2020-01-01 2020-12-31 0001578732 srt:MaximumMember us-gaap:GeographicConcentrationRiskMember us-gaap:SalesRevenueNetMember country:CA mmi:CustomerMember 2019-01-01 2019-12-31 0001578732 mmi:TransactionRiskMember mmi:CustomerMember us-gaap:SalesRevenueNetMember 2019-01-01 2019-12-31 0001578732 us-gaap:CustomerConcentrationRiskMember us-gaap:SalesRevenueNetMember mmi:CustomerMember 2019-01-01 2019-12-31 0001578732 us-gaap:GeographicConcentrationRiskMember us-gaap:SalesRevenueNetMember mmi:CustomerMember 2019-01-01 2019-12-31 0001578732 us-gaap:CustomerConcentrationRiskMember mmi:CommissionReceivableMember mmi:CustomerMember 2019-01-01 2019-12-31 0001578732 mmi:MarcusAndMillichapCompanyMember mmi:TransitionServicesAgreementMember 2019-01-01 2019-12-31 0001578732 mmi:MarcusAndMillichapCompanyMember 2019-01-01 2019-12-31 0001578732 us-gaap:GeographicConcentrationRiskMember us-gaap:SalesRevenueNetMember 2019-01-01 2019-12-31 0001578732 mmi:EmployeeStockPurchasePlanMember 2019-01-01 2019-12-31 0001578732 us-gaap:RestrictedStockMember mmi:NonEmployeeDirectorMember 2019-01-01 2019-12-31 0001578732 us-gaap:RestrictedStockUnitsRSUMember us-gaap:EmployeeStockMember 2019-01-01 2019-12-31 0001578732 us-gaap:RestrictedStockUnitsRSUMember mmi:IndependentContractorsSubsequentToAdoptionOfNewStandardMember 2019-01-01 2019-12-31 0001578732 mmi:IndependentContractorsMember us-gaap:RestrictedStockUnitsRSUMember 2019-01-01 2019-12-31 0001578732 us-gaap:PreferredStockMember 2019-01-01 2019-12-31 0001578732 us-gaap:CommonStockMember 2019-01-01 2019-12-31 0001578732 us-gaap:AdditionalPaidInCapitalMember 2019-01-01 2019-12-31 0001578732 us-gaap:ReceivablesFromStockholderMember 2019-01-01 2019-12-31 0001578732 us-gaap:RetainedEarningsMember 2019-01-01 2019-12-31 0001578732 us-gaap:AccumulatedOtherComprehensiveIncomeMember 2019-01-01 2019-12-31 0001578732 mmi:FinancingFeesMember 2019-01-01 2019-12-31 0001578732 mmi:OtherRevenuesMember 2019-01-01 2019-12-31 0001578732 mmi:RealEstateBrokerageCommissionsMember 2019-01-01 2019-12-31 0001578732 us-gaap:StockAppreciationRightsSARSMember 2019-01-01 2019-12-31 0001578732 mmi:CreditAgreementMember 2019-01-01 2019-12-31 0001578732 mmi:ContributionPlanMember 2019-01-01 2019-12-31 0001578732 country:US 2019-01-01 2019-12-31 0001578732 mmi:ForeignMember 2019-01-01 2019-12-31 0001578732 mmi:TwoThousandAndThirteenOmnibusEquityAwardPlanMember mmi:RestrictedStockUnitsAndRestrictedStockAwardsMember 2019-01-01 2019-12-31 0001578732 mmi:TwoThousandAndThirteenOmnibusEquityAwardPlanMember mmi:DeferredStockUnitsMemberMember 2019-01-01 2019-12-31 0001578732 us-gaap:StockAppreciationRightsSARSMember 2013-03-31 0001578732 us-gaap:StockAppreciationRightsSARSMember 2014-01-01 2014-01-01 0001578732 mmi:DeferredStockUnitsMember 2013-11-05 2013-11-05 0001578732 mmi:SemiAnnualRegularDividendMember us-gaap:SubsequentEventMember 2022-02-16 0001578732 mmi:SpecialDividendMember us-gaap:SubsequentEventMember 2022-02-16 0001578732 us-gaap:SubsequentEventMember 2022-02-16 0001578732 mmi:UnvestedRestrictedStockAndDeferredStockUnitsMember us-gaap:SubsequentEventMember mmi:TwoThousandThirteenPlanMember 2022-02-16 0001578732 mmi:UnvestedRestrictedStockAndDeferredStockUnitsMember us-gaap:SubsequentEventMember mmi:TwoThousandAndThirteenOmnibusEquityAwardPlanMember 2022-02-16 0001578732 us-gaap:SubsequentEventMember 2022-02-16 2022-02-16 0001578732 us-gaap:StockAppreciationRightsSARSMember 2021-01-01 2021-01-01 0001578732 us-gaap:StockAppreciationRightsSARSMember 2020-01-01 2020-01-01 0001578732 us-gaap:StockAppreciationRightsSARSMember 2019-01-01 2019-01-01 0001578732 us-gaap:PreferredStockMember 2021-12-31 0001578732 us-gaap:CommonStockMember 2021-12-31 0001578732 us-gaap:AdditionalPaidInCapitalMember 2021-12-31 0001578732 us-gaap:ReceivablesFromStockholderMember 2021-12-31 0001578732 us-gaap:RetainedEarningsMember 2021-12-31 0001578732 us-gaap:AccumulatedOtherComprehensiveIncomeMember 2021-12-31 0001578732 srt:CumulativeEffectPeriodOfAdoptionAdjustedBalanceMember 2019-12-31 0001578732 mmi:ContingentConsiderationMember 2019-12-31 0001578732 us-gaap:RestrictedStockMember mmi:NonEmployeeDirectorMember 2020-12-31 0001578732 us-gaap:EmployeeStockMember us-gaap:RestrictedStockUnitsRSUMember 2020-12-31 0001578732 us-gaap:RestrictedStockUnitsRSUMember mmi:IndependentContractorsMember 2020-12-31 0001578732 us-gaap:AccountingStandardsUpdate201613Member 2019-12-31 0001578732 us-gaap:PreferredStockMember 2020-12-31 0001578732 us-gaap:CommonStockMember 2020-12-31 0001578732 us-gaap:AdditionalPaidInCapitalMember 2020-12-31 0001578732 us-gaap:ReceivablesFromStockholderMember 2020-12-31 0001578732 us-gaap:RetainedEarningsMember 2020-12-31 0001578732 us-gaap:AccumulatedOtherComprehensiveIncomeMember 2020-12-31 0001578732 us-gaap:ReceivablesFromStockholderMember 2018-12-31 0001578732 us-gaap:PreferredStockMember 2018-12-31 0001578732 us-gaap:CommonStockMember 2018-12-31 0001578732 us-gaap:AdditionalPaidInCapitalMember 2018-12-31 0001578732 us-gaap:RetainedEarningsMember 2018-12-31 0001578732 us-gaap:AccumulatedOtherComprehensiveIncomeMember 2018-12-31 0001578732 us-gaap:PreferredStockMember srt:CumulativeEffectPeriodOfAdoptionAdjustedBalanceMember 2018-12-31 0001578732 us-gaap:CommonStockMember srt:CumulativeEffectPeriodOfAdoptionAdjustedBalanceMember 2018-12-31 0001578732 us-gaap:AdditionalPaidInCapitalMember srt:CumulativeEffectPeriodOfAdoptionAdjustedBalanceMember 2018-12-31 0001578732 us-gaap:ReceivablesFromStockholderMember srt:CumulativeEffectPeriodOfAdoptionAdjustedBalanceMember 2018-12-31 0001578732 us-gaap:RetainedEarningsMember srt:CumulativeEffectPeriodOfAdoptionAdjustedBalanceMember 2018-12-31 0001578732 us-gaap:AccumulatedOtherComprehensiveIncomeMember srt:CumulativeEffectPeriodOfAdoptionAdjustedBalanceMember 2018-12-31 0001578732 mmi:IndependentContractorsMember us-gaap:RestrictedStockUnitsRSUMember 2018-12-31 0001578732 us-gaap:RestrictedStockUnitsRSUMember us-gaap:EmployeeStockMember 2018-12-31 0001578732 us-gaap:RestrictedStockMember mmi:NonEmployeeDirectorMember 2018-12-31 0001578732 us-gaap:RestrictedStockMember mmi:NonEmployeeDirectorMember 2019-12-31 0001578732 us-gaap:RestrictedStockUnitsRSUMember us-gaap:EmployeeStockMember 2019-12-31 0001578732 us-gaap:RestrictedStockUnitsRSUMember mmi:IndependentContractorsMember 2019-12-31 0001578732 us-gaap:PreferredStockMember 2019-12-31 0001578732 us-gaap:CommonStockMember 2019-12-31 0001578732 us-gaap:AdditionalPaidInCapitalMember 2019-12-31 0001578732 us-gaap:ReceivablesFromStockholderMember 2019-12-31 0001578732 us-gaap:RetainedEarningsMember 2019-12-31 0001578732 us-gaap:AccumulatedOtherComprehensiveIncomeMember 2019-12-31 0001578732 us-gaap:PreferredStockMember srt:CumulativeEffectPeriodOfAdoptionAdjustmentMember 2019-12-31 0001578732 us-gaap:CommonStockMember srt:CumulativeEffectPeriodOfAdoptionAdjustmentMember 2019-12-31 0001578732 us-gaap:AdditionalPaidInCapitalMember srt:CumulativeEffectPeriodOfAdoptionAdjustmentMember 2019-12-31 0001578732 us-gaap:ReceivablesFromStockholderMember srt:CumulativeEffectPeriodOfAdoptionAdjustmentMember 2019-12-31 0001578732 us-gaap:RetainedEarningsMember srt:CumulativeEffectPeriodOfAdoptionAdjustmentMember 2019-12-31 0001578732 us-gaap:AccumulatedOtherComprehensiveIncomeMember srt:CumulativeEffectPeriodOfAdoptionAdjustmentMember 2019-12-31 0001578732 srt:CumulativeEffectPeriodOfAdoptionAdjustmentMember 2019-12-31 iso4217:USD xbrli:pure utr:Year xbrli:shares utr:Day utr:Month mmi:Office iso4217:USD xbrli:shares mmi:Segment utr:Y
Table of Contents
 
 
UNITED STATES
SECURITIES AND EXCHANGE COMMISSION
Washington, D.C. 20549
 
 
FORM
10-K
 
 
(Mark One)
ANNUAL REPORT PURSUANT TO SECTION 13 OR 15(d) OF THE SECURITIES EXCHANGE ACT OF 1934
For the fiscal year ended December 31, 2021
OR
 
TRANSITION REPORT PURSUANT TO SECTION 13 OR 15(d) OF THE SECURITIES EXCHANGE ACT OF 1934
For the transition period from                 to                 .
Commission File Number
001-36155
 
 
MARCUS & MILLICHAP, INC.
(Exact name of registrant as specified in its charter)


Delaware
 
35-2478370
(State or other jurisdiction of
incorporation or organization)
 
(I.R.S. Employer
Identification No.)
23975 Park Sorrento, Suite 400 Calabasas, California, 91302
(Address of principal executive offices, including zip code)
Registrant’s telephone number, including area code: (818)
212-2250
Securities registered pursuant to Section 12(b) of the Act:


Title of each class
 
Trading Symbol (s)
  
Name of each exchange on which registered
Common Stock, par value $0.0001 per share
 
MMI
  
New York Stock Exchange
Securities registered pursuant to Section 12(g) of the Act: None
 
 
Indicate
by check mark if the registrant is a well-known seasoned issuer, as defined in Rule 405 of the Securities
Act.    
Yes
  ☒    No  ☐
Indicate by check mark if the registrant is not required to file reports pursuant to Section 13 or Section 15(d) of the
Act.    Ye
s  ☐     
No
  ☒
Indicate by check mark whether the registrant (1) has filed all reports required to be filed by Section 13 or 15(d) of the Securities Exchange Act of 1934 during the preceding 12 months (or for such shorter period that the registrant was required to file such reports), and (2) has been subject to such filing requirements for the past 90 days.    Yes  ☒    No  ☐
Indicate by check mark whether the registrant has submitted electronically every Interactive Data File required to be submitted pursuant to Rule 405 of Regulation
S-T
(§ 232.405 of this chapter) during the preceding 12 months (or for such shorter period that the registrant was required to submit and such files).    Yes  ☒
    No  ☐
Indicate by check mark whether the registrant is a large accelerated filer, an accelerated filer, a
non-accelerated
filer, a smaller reporting company, or an emerging growth company. See the definitions of “large accelerated filer,” “accelerated filer,” “smaller reporting company” and “emerging growth company” in Rule
12b-2
of the Exchange Act.
 
Large accelerated filer     ☒   Accelerated filer  
Non-accelerated
filer
    ☐   Smaller reporting company  
Emerging growth company  


If an emerging growth company, indicate by check mark if the registrant has elected not to use the extended transition period for complying with any new or revised financial accounting standards provided pursuant to Section 13(a) of the Exchange Act.  ☐
Indicate by check mark whether the registrant has filed a report on and attestation to its management’s assessment of the effectiveness of its internal control over financial reporting under Section 404(b) of the Sarbanes-Oxley Act (15 U.S.C. 7262(b)) by the registered public accounting firm that prepared or issued its audit report.  
Indicate by check mark whether the registrant is a shell company (as defined in Rule
12b-2
of the
Act).    Yes  ☐    
No
  
The aggregate market value of the registrant’s voting stock held by
non-affiliates
at June 30, 2021 was approximately $937.2 million, based on the closing price per share of common stock on June 30, 2021 of $
38.87
as reported on the New York Stock Exchange. Shares of common stock known by the registrant to be beneficially owned by directors and executive officers of the registrant and 10% stockholders are not included in the computation. The registrant, however, has made no determination that such persons are “affiliates” within the meaning of
Rule 12b-2
under the Securities Exchange Act of 1934.
As of February 15, 2022, there were 39,693,316 shares of the registrant’s common stock
outstanding.
 
 
DOCUMENTS INCORPORATED BY REFERENCE
Portions of the registrant’s Proxy Statement to be delivered to stockholders in connection with the annual meeting of stockholders to be held on May 3, 2022 are incorporated by reference into Part III of this Annual Report on Form
10-K.
Such Proxy Statement will be filed with the United States Securities and Exchange Commission (the “SEC”) within 120 days of the registrant’s fiscal year ended December 31, 2021.


Table of Contents
TABLE OF CONTENTS


Page


4


19


34


34


34


35


36


37


38


54


54


54


55


56


56


57


58


59


59


59


60


62


63
 
MARKET, INDUSTRY AND OTHER DATA
Unless otherwise indicated, information contained in this Annual Report on Form
10-K
concerning the commercial real estate industry and the markets in which we operate, including our general expectations and market position, market opportunity and market size, is based on (i) information gathered from various sources, (ii) certain assumptions that we have made, and (iii) on our knowledge of the commercial real estate market. While we believe that the market position, market opportunity and market size information that is included in this Annual Report on Form
10-K
is generally reliable, such information is inherently imprecise. Unless indicated otherwise, the industry data included herein is generally based on information available through the nine months ended September 30, 2021 since full year 2021 information may not yet have been published. We use market data from Costar Group, Inc. and Real Capital Analytics that consists of list side information of sales transactions of multifamily, retail, office and industrial buildings, with a value of $1 million or more.
 
2

Table of Contents
SPECIAL NOTE REGARDING FORWARD-LOOKING STATEMENTS
This Annual Report on Form
10-K
includes forward-looking statements, including the Company’s business outlook for 2022, the potential continuing impact of the
COVID-19
pandemic, the execution of our capital return program, including the initiation of a semi-annual dividend policy, and expectations for market share growth. We have based these forward-looking statements largely on our current expectations and projections about future events and financial trends affecting the financial condition of our business. Forward-looking statements should not be read as a guarantee of future performance or results and will not necessarily be accurate indications of the times at, or by, which such performance or results may be achieved. Forward-looking statements are based on information available at the time those statements are made and/or management’s good faith belief as of that time with respect to future events and are subject to risks and uncertainties that could cause actual performance or results to differ materially from those expressed in or suggested by the forward-looking statements. Important factors that could cause such differences include, but are not limited to:


uncertainties relating to the economic, operational and financial impact of the ongoing
COVID-19
pandemic, including uncertainties regarding the potential impact of new variants, vaccination rates and vaccine mandates on our workforce;


general uncertainty in the capital markets and a worsening of economic conditions and the rate and pace of economic recovery following an economic downturn;


changes in our business operations;


market trends in the commercial real estate market or the general economy, including the impact of inflation;


our ability to attract and retain qualified senior executives, managers and investment sales and financing professionals;


the effects of increased competition on our business;


our ability to successfully enter new markets or increase our market share;


our ability to successfully expand our services and businesses and to manage any such expansions;


our ability to retain existing clients and develop new clients;


our ability to keep pace with changes in technology;


any business interruption or technology failure, including cyber and ransomware attacks, and any related impact on our reputation;


changes in interest rates, availability of capital, tax laws, employment laws or other government regulation affecting our business;


our ability to successfully identify, negotiate, execute and integrate accretive acquisitions; and


other risk factors included under “Risk Factors” in this Annual Report on Form
10-K.
In addition, in this Annual Report, the words “believe,” “may,” “will,” “estimate,” “continue,” “anticipate,” “intend,” “expect,” “predict,” “potential,” “should” and similar expressions, as they relate to our company, our business and our management, are intended to identify forward-looking statements. In light of these risks and uncertainties, the forward-looking events and circumstances discussed in this Annual Report on Form
10-K
may not occur and actual results could differ materially from those anticipated or implied in the forward-looking statements.
Forward-looking statements speak only as of the date of this Annual Report on Form
10-K.
You should not put undue reliance on any forward-looking statements. We assume no obligation to update forward-looking statements to reflect actual results, changes in assumptions or changes in other factors affecting forward-looking information, except to the extent required by applicable laws. If we update one or more forward-looking statements, no inference should be drawn that we will make additional updates with respect to those or other forward-looking statements.
 
3

Table of Contents
PART I
Unless the context requires otherwise, the words “Marcus & Millichap,” “MMI,” “we,” the “Company,” “us” and “our” refer to Marcus & Millichap, Inc., and its consolidated subsidiaries.
Item 1. Business
Company Overview
Marcus & Millichap, Inc. (“MMI”) is a leading national real estate services firm specializing in commercial real estate investment sales, financing, research and advisory services. We are the leading national investment brokerage company in the
$1-$10 million
private client market segment. This is the largest and most active market segment and comprised approximately 84% of total U.S. commercial property transactions greater than $1 million in the marketplace in 2021. As of December 31, 2021, we had 1,994 investment sales and financing professionals that are primarily exclusive commission-based independent contractors who provide real estate investment brokerage and financing services to sellers and buyers of commercial real estate in 82 offices in the United States and Canada. In 2021, we closed 13,255 sales, financing and other transactions with total sales volume of approximately $84.4 billion.
We service clients by underwriting, marketing, selling and financing commercial real estate properties in a manner that maximizes value for sellers, provides buyers with the largest and most diverse inventory of commercial properties and secures the most competitive financing from lenders for borrowers. Our business model is based on several key attributes:
 
   
a
51-year
history of providing investment brokerage and financing services through proprietary inventory and marketing systems, policies and culture of information sharing and
in-depth
investment brokerage training. These services are executed by our salesforce under the supervision of a dedicated sales management team focused on client service and growing the firm;
 
   
market leading share and brand within the
$1-$10 million
private client market segment, which consistently represents more than 80% of total U.S. commercial property transactions greater than $1 million in the marketplace;
 
   
investment sales and financing professionals providing exclusive client representation across multiple property types;
 
   
a broad geographic platform in the United States and Canada powered by information sharing and proprietary real estate marketing technologies;
 
   
an ability to scale with our private clients as they grow and connect private capital with larger assets through our Institutional Property Advisors (“IPA”) division;
 
   
a financing team integrated with our brokerage sales force providing independent mortgage brokerage services by accessing a wide range of lenders on behalf of our clients;
 
   
a sales management team, who serves in a support and leadership role as company executives and who does not compete with or participate in investment sales or financing professionals’ commissions; and
 
   
industry-leading research and advisory services tailored to the needs of our clients and supporting our investment sales and financing professionals.
Corporate Information
We were formed as a sole proprietorship in 1971, incorporated in California on August 26, 1976 as G. M. Marcus & Company, and we were renamed as Marcus & Millichap, Inc. in August 1978, Marcus & Millichap Real Estate Investment Brokerage Company in September 1985, and Marcus & Millichap Real Estate Investment
 
4

Table of Contents
Services, Inc., (“MMREIS”), in February 2007. Prior to the completion of our initial public offering (“IPO”), MMREIS was majority-owned by Marcus & Millichap Company (“MMC”) and all of MMREIS’ preferred and common stock outstanding was held by MMC and its affiliates or officers and employees of MMREIS. In June 2013, in preparation for the
spin-off
of its real estate investment services business, MMC formed a Delaware holding company called Marcus & Millichap, Inc., or MMI. Prior to the completion of our IPO in November 2013, the shareholders of MMREIS contributed the shares of MMREIS to MMI in exchange for common stock of MMI, and MMREIS became a wholly-owned subsidiary of MMI.
Our Services
We generate revenues by collecting real estate brokerage commissions upon the sale, and fees upon the financing, of commercial properties, and by providing equity advisory services, loan sales and consulting and advisory services. Real estate brokerage commissions are typically based upon the value of the property and financing fees are typically based upon the size of the loan. In 2021, approximately 90% of our revenues were generated from real estate brokerage commissions, 9% from financing fees and 1% from other revenues, including consulting and advisory services.
We divide commercial real estate into four major market segments, characterized by price in order to understand trends in our revenue from period to period:
 
   
Properties priced less than $1 million;
 
   
Private client market:
properties priced from $1 million to up to but less than $10 million;
 
   
Middle market:
properties priced from $10 million to up to but less than $20 million; and
 
   
Larger transaction market:
properties priced from $20 million and above.
We serve clients with one property, multiple properties and large investment portfolios. The largest group of investors we serve typically transacts in the
$1-$10 million
private client market segment. The investment brokerage and financing professionals serving private clients within the private client market segment represent the largest part of our business, which differentiates us from our competitors. In 2021, approximately 59% of our brokerage commissions came from this market segment. Properties in this market segment are characterized by higher asset turnover rates due to the type of investor as compared to other market segments. Private clients are often motivated to buy, sell and/or refinance properties not only for business reasons but also due to personal circumstances, such as death, divorce, taxes, changes in partnership structures and other personal or financial circumstances. Therefore, private client investors are influenced less by the macroeconomic trends than other large-scale investors, making the private client market segment less volatile over the long-term than other market segments. Accordingly, our business model distinguishes us from our national competitors, who may focus primarily on the more volatile larger transaction and middle market segments, or on other business activities such as leasing or property management, and from our local and regional competitors, who lack a broad national platform.
Geographic Locations
We were founded in 1971 in the western United States, and we continue to increase our presence throughout North America through execution of our growth strategies by targeting markets based on population, employment, level of commercial real estate sales, inventory and competitive landscape opportunities where we believe the markets will benefit from our business model. We have grown to have offices in 36 states across the United States and in four provinces in Canada.
 
5

Table of Contents
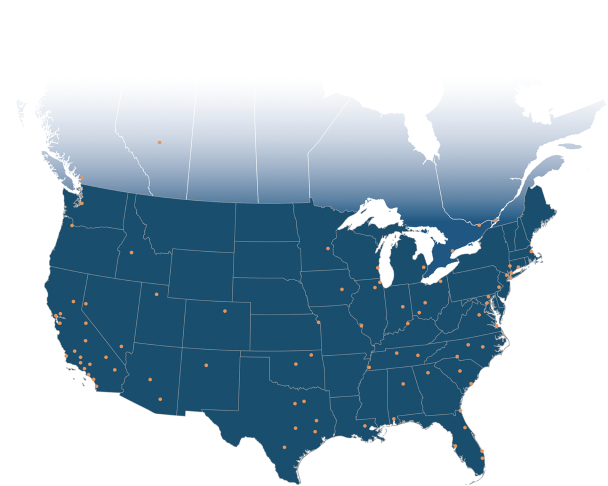
Below is a map reflecting the geographic location of our 82 offices as of December 31, 2021.
Commercial Real Estate Investment Brokerage
Our primary business and source of revenue is the representation of commercial property owners as their exclusive investment broker in the sale of their properties. Our investment sales professionals also represent buyers in fulfilling their investment real estate acquisition needs. Commissions from real estate investment brokerage sales accounted for approximately 90% of our revenues in 2021. Sales are generated by maintaining relationships with property owners, providing market information and trends to them during their investment or “hold” period and being selected as their representative when they decide to sell, buy additional property or exchange their property for another property. We collect commissions upon the sale of each property based on a percentage of sales price. These commission percentages are typically inversely correlated with sales price and thus are generally higher for smaller transactions.
We underwrite, value and market properties to reach the largest and most qualified pool of buyers. We offer our clients the industry’s largest team of investment sales professionals, who operate with a culture and policy of information sharing powered by our proprietary system, MNet, which enables real-time buyer-seller matching. We use a proactive marketing campaign that leverages the investor relationships of our entire sales force, direct marketing and a suite of proprietary
web-based
tools that connects each asset with the right buyer pool. We strive to maximize value for the seller by generating high demand for each property. Our approach also provides a diverse, consistently underwritten inventory of investment real estate for buyers. When a client engages one of our investment sales professionals, they are engaging an entire system, structure and organization committed to maximizing value for them.
 
6

Table of Contents
In 2021, we closed 9,652 real estate brokerage transactions in a broad range of commercial property types, with a total sales volume of approximately $67.5 billion. For more than 15 years, we have closed more transactions than any other firm.
We are building on our track record of strength in multifamily, retail, office and industrial properties by expanding our coverage of additional property types. These include hospitality, self-storage, seniors housing, land and manufactured housing properties, where we are already a leading broker but have significant room for additional growth due to market size, fragmentation and specific geographic market opportunities. We are also expanding our specialty group management and support infrastructure, specialized branding and business development customized for each property type. In addition, we are continuously focusing on our recruitment efforts for new and experienced investment sales and financing professionals. We expect that these efforts will expand our presence and result in increased business in these property types.
We service clients in all market segments by underwriting, marketing, selling and financing commercial real estate properties in a manner that maximizes value for sellers and provides buyers with the largest and most diverse inventory of commercial properties. In addition, we achieved growth by leveraging the strength of our relationships in the private client market segment to increase our share of the middle and larger transaction market segments. Because commission rates earned on commercial properties are typically inversely correlated with sales price, our expansion into the middle and larger transaction market segments, has led to our average commission rates fluctuating from
period-to-period
as a result of changes in the relative mix of transactions closed in the middle and larger transaction market segments as compared to the private client market segment.
The following table sets forth the number of investment sales transactions, sales volume and revenue by commercial real estate market segment for real estate brokerage in 2021 compared to 2020:
 
   
2021
   
2020
   
Change
 
Real Estate Brokerage:
 
Number
   
Volume
   
Revenues
   
Number
   
Volume
   
Revenues
   
Number
   
Volume
   
Revenues
 
         
(in millions)
   
(in thousands)
         
(in millions)
   
(in thousands)
         
(in millions)
   
(in thousands)
 
<$1 million
    1,087     $ 732     $ 30,681       944     $ 600     $ 24,456       143     $ 132     $ 6,225  
Private client market ($1 - <$10 million)
    7,300       24,339       693,996       4,773       15,115       421,767       2,527       9,224       272,229  
Middle market ($10 - <$20 million)
    643       8,874       170,230       316       4,311       81,621       327       4,563       88,609  
Larger transaction market (≥$20 million)
    622       33,562       276,062       255       12,026       105,320       367       21,536       170,742  


    9,652     $  67,507     $ 1,170,969       6,288     $  32,052     $  633,164       3,364     $  35,455     $  537,805  


Financing
Marcus & Millichap Capital Corporation (“MMCC”) is a financial intermediary that provides commercial real estate capital markets solutions, including senior debt, mezzanine debt, joint venture and preferred equity, as well as loan sales and consultative/due diligence services to commercial real estate owners, developers, investors and capital providers. Our advisors assist clients to secure capital for both acquisitions and the refinancing of single assets and portfolios. MMCC generates revenue from advisory fees collected from capital placement with an assortment of capital providers including national and regional banks, credit unions, private equity funds, insurance companies, government agencies, including the Federal National Mortgage Association (“Fannie Mae”), the Federal Home Loan Mortgage Corporation (“Freddie Mac”) and the Federal Housing Administration (“FHA”), conduit lenders, debt funds, hard money lenders, and structured debt facilitators (including preferred equity and mezzanine providers). MMCC additionally receives
on-going
servicing fees from certain lenders and other incentive-based fees based on achieving certain production thresholds. MMCC’s financing fees vary by loan amount, transactional complexity and loan type. In 2021, MMCC completed 2,474 financing transactions representing total financing volume of approximately $11.6 billion, resulting in $109.7 million in financing fees, accounting for approximately 9% of MMI’s total revenue. The combination of MMCC’s size, market reach and
 
7

Table of Contents
financing volume enables us to establish long-term relationships with various capital sources. This, in turn, improves MMCC’s value proposition to borrowers who are seeking competitive rates and terms. MMCC seeks to secure the most competitive financing solutions for each client’s specific needs and requirements. During 2021, approximately 36% of MMCC’s revenues came from placing acquisition financing, 42% from refinancing activities and 22% from other financing activities.
MMCC is fully integrated with the investment sales force in our brokerage offices. MMCC financing professionals are supervised by our MMCC management team and regional managers, who promote cross-selling, information sharing, business referrals and high-quality customer service within the offices. The MMCC national network of financing professionals is also supported by a dedicated, nationally focused management team coordinating access to a broad range of national and regional capital sources. By combining these resources with the latest property and capital markets data and information, we can differentiate ourselves in the marketplace and deliver tailored financial solutions that meet our clients’ financial objectives. During 2021, MMCC entered into a strategic alliance with M&T Realty Capital Corporation (“M&T Realty Capital”) enabling MMCC to provide clients with increased access to M&T Realty Capital’s affordable and conventional multifamily agency financing through a highly streamlined process with dedicated resources. M&T Realty Capital has a Delegated Underwriting and Servicing Agreement (“DUS Agreement”) with Fannie Mae and is an approved lender for Freddie Mac’s Conventional and Targeted Affordable Housing loans.
Ancillary Services: Research, Advisory and Consulting
Our research, advisory and consulting services are designed to assist clients in forming their investment strategy and making transaction decisions. Our advisory and consulting services are coordinated with both our investment sales and financing professionals and are designed to provide market and property focused market research, publications and customized analysis that increase customer loyalty and long-term relationships.
We provide a wide range of advisory and consulting services to developers, lenders, owners, real estate investment trusts, high net worth individuals, pension fund advisors and other institutions. Our advisory services include opinions of value, operating and financial performance benchmarking analysis, specific asset
buy-sell
strategies, market and submarket analysis and ranking, portfolio strategies by property type, market strategy, development and redevelopment feasibility studies and other services.
Competitive Strengths
We believe the following strengths provide us with a competitive advantage and opportunities for success:
National Platform Built on Investment Brokerage and Financing Services
We have built a leading national platform serving our clients’ needs of investment brokerage and financing services. We continue to be focused on investment brokerage, financing and other services complementary to our business. Our commitment to specialization is reflected in how we generally organize our investment sales and financing professionals by market area and property type, which enhances our investment sales and financing professionals’ skills, relationships and market knowledge required for achieving the best results for our clients. As a result of these founding principles, we offer an efficient system of matching every property with the largest pool of qualified buyers and therefore maximizing value in the process.
Market Leader in the Private Client Market Segment
Since our founding, we have focused on being the leading service provider to the
$1-$10 million
private client market segment. This segment is the largest by ownership and transaction count and consistently accounts for over 80% of total U.S. commercial property transactions and over 60% of the commission pool. It is comprised of
high-net-worth
individuals, partnerships and small private fund managers with both passive,
 
8

Table of Contents
long-term
investments, as well as those with opportunistic and short-term investment horizons. Private clients are often motivated to buy, sell and/or refinance properties not only for business reasons but also due to personal and financial circumstances. The vast size and personal transaction drivers of private clients make this market segment the most active in terms of sales velocity. In addition, this market segment is highly fragmented with the top 10 brokerage firms accounting for approximately 23% of transactions in 2021. We are the leading broker in the
$1-$10 million
private client market segment based on transaction count in 2021. With our established market leadership and brand name, we have significant room for market share expansion by further consolidating our leadership position in this market segment.
In addition, the private client market segment is characterized by high barriers to entry. These barriers include the need for a large, specialized sales force prospecting private clients, the difficulties in identifying, establishing, and maintaining relationships with such investors, capabilities of exposing properties to a large pool of potential buyers and the challenge of serving their needs locally, regionally and nationally. We believe this private client market segment is the least covered market segment by other national firms and is significantly underserved by local and regional firms that lack a national platform.
Platform Built for Maximizing Investor Value
We have built our business to maximize value for real estate investors through an integrated set of services geared toward our clients’ needs. We are committed to an investment brokerage specialization and providing one of the largest sales force in the industry, promoting a culture and policy of information sharing on each property we represent, and equipping our investment sales professionals with exclusive real estate inventory and marketing technologies that enhance the marketability of the properties we represent. Our system generates real-time buyer-seller matching and maximizes value one property at a time. Our investment sales organization can therefore underwrite and market investment real estate to the largest pool of qualified buyers. We coordinate proactive marketing campaigns across investor relationships and resources of the entire firm, far beyond the capabilities of an individual listing agent. These efforts produce wide exposure to investors whom we identify as high-probability bidders for each property. To grow with our clients, we established the IPA division to serve the needs of our private client investors that are now seeking higher valued properties as well as larger institutional investors. Our ability to bridge private capital with larger, institutional assets creates value for private and larger transaction clients while offering growth opportunities and strengthening the retention of our investment sales and financing professionals.
We have one of the largest teams of financing professionals in the investment brokerage industry through MMCC. MMCC provides financing expertise and access to debt and capital sources by identifying and securing competitive loan pricing and terms for our clients across a broad range of potential lenders and financing alternatives. Based on the most recent data, we are a leading mortgage broker in the industry based on the number of financing transactions closed in 2020. Our dedicated market research teams analyze the latest local and national economic and real estate trends and produce proprietary analyses for our clients enabling them to make informed investment and financing decisions. Integrating all these services into one national platform increases opportunities to maximize value for our clients across multiple property types, market segments and geographies.
Local Management with Significant Investment Brokerage Experience
Our local management team members, as executives of the Company, are dedicated to recruiting, training, developing and supporting our investment sales and financing professionals. The majority of our local management team are former senior investment sales professionals of our Company who now focus on management, do not compete with our sales force
and have an average of 13 years of real estate investment brokerage experience with our Company. Our training, development and mentoring programs rely greatly on the regional managers’ personal involvement. Their past experience as senior investment sales professionals plays a key role in developing new and experienced investment sales and financing professionals. They help our junior professionals to establish technical and client service skills as well as set up, develop and grow relationships with
 
9

Table of Contents
clients. We believe this management structure has helped differentiate the firm from our competitors and ultimately achieves better results for our clients.
Growth Strategy
We have demonstrated the ability, over the long-term, to manage through the cyclical market and continue to be a leader in the
$1-10 million
private client market segment. The following graph shows the number of transactions and sales volume of investment sales, financing and other transactions from 2012 to 2021:


We have a long track record of growing our business model driven by opening new offices, recruiting, training and developing new investment sales and financing professionals as well as deploying our client-focused business model to increase coverage of specialty property types and the middle and larger transaction market segments. Our long-term growth plan has focused on investing in our current business model through organic growth and acquisitions to provide our unique business model to a wider client base. Since 2012, our revenue has increased more than threefold, and we have grown from slightly over 1,000 investment sales and financing professionals to nearly 2,000 in the United States and Canada. Our future growth will depend on continually expanding our national footprint and optimizing the size, product segmentation and specialization of our team of investment sales and financing professionals. The key strategies of our growth plan include:
Increase Market Share in the Private Client Market Segment
Our leading position in the private client market segment and inherent fragmentation continues to provide significant opportunity for us to expand and bring our client service offerings to a larger portion of this expansive market segment. We can continue to leverage our existing platform, relationships and brand recognition among private clients to grow through expanded marketing and coverage.
Focused Office Expansion
Since we currently have offices in most major-market and
mid-market
metropolitan cities, our growth is expected to come from focused expansion of existing offices and new offices from acquisitions, targeted hiring and increased coverage of specialty property types. We have targeted markets based on population, employment, level of commercial real estate sales, inventory and competitive landscape. Our optimal office plans are used to capitalize on these factors by tailoring sales force size, coverage and composition by office and business activity to direct efforts to offices with the most opportunity where we believe we can leverage our national footprint and
 
10

Table of Contents
proprietary real estate marketing technologies. These initiatives do not require significant increases in the number of offices or in the size of our offices, which allows us to leverage our current office locations without significant incremental investment.
Expand and Develop Our Team of Investment Sales Professionals
A key to growing our business is hiring, training and developing investment sales professionals. We are always focused on hiring experienced investment sales professionals through our recruiting department, specialty directors and regional managers in support of our optimal office plans.
Our new investment sales professionals are trained in all aspects of real estate fundamentals, client service and proprietary marketing technologies through formal training, apprenticeship programs, the Millichap Fellowship Program (discussed below) and mentorship by our dedicated regional, district and division managers, as well as our senior investment sales and financing professionals. As these investment sales professionals mature, we continue to provide them with identified best practices and training in specialty property types. We believe this model creates a high level of teamwork, as well as operational and client service consistency. Please see “Human Capital Management” for more information.
Pursue Selective Acquisitions
Acquisitions have become a strategy to supplement the growth of our salesforce and the services that we provide to our clients. We continually explore acquisition opportunities to augment our investment brokerage and financing services businesses. We primarily look for acquisitions of
small-to-medium
size investment brokerage and financing services businesses with teams of professionals with consistent revenue and earnings trends, which will expand our geographic or property type coverage.
Grow in Specialty Property Types and Middle and Larger Transaction Market Segment Presence
Leveraging our current business model into specialty property types and to the middle and larger transaction market segments opens up significant opportunities for growth.
Specialty Property Types
We believe that specialty property types, including hospitality, self-storage, seniors housing, land and manufactured housing offer significant opportunities for our clients. By deploying our unique business model to increase coverage of these property types, we can create growth for us as well as enhance value for our clients through diversification. To create these opportunities, we are increasing our property type expertise by continuing to strategically add specialty directors who can bring added management capacity, business development and investment sales professional support. These executives will work with our sales management team to increase investment sales professional hiring, training, development and redeployment and to execute various branding and marketing campaigns to expand our presence in these targeted property types.
Middle and Larger Transaction Market Segments Presence
Our extensive relationships with private client investors who typically invest in the
$1-$10 million
private client market segment have enabled us to capture a greater portion of commercial real estate transactions in excess of $10 million and bridge the private client market investor to the middle market and larger transaction market segments in recent years. As property values increase and investors grow and expand, they require larger properties. We are organized to provide our unique investment brokerage and financing services to investors in those market segments. Our ability to connect private client capital with middle and larger transaction market segment properties allows us to continue to serve our clients as they grow and plays a major role in differentiating our services. The IPA division is a group dedicated to service larger investors. This strategy has had market acceptance and provides a vehicle for growth by delivering our unique service platform within the
 
11

Table of Contents
middle and larger transaction market segments for the multifamily, retail and office property types. The growth of our investors and introduction of IPA has driven incremental growth for us. During 2021, we continued to take steps to achieve our growth plan by hiring multiple investment sales teams into our IPA division.
Expand Marcus & Millichap Capital Corporation Financing Business
Our growth plan for MMCC continues to focus on expanding our capital markets services in markets currently served by our investment sales brokerage offices and other strategic markets. This includes increasing the capacity of the existing professionals in offices we currently serve and integrating financing professionals and related services in offices that do not have an MMCC presence. We will also continue to expand our service platform by increasing access to a broad array of new capital resources and pursuing selective acquisitions. We have and continue to expand MMCC’s capital markets advisory services and added complementary services in loan sales, consultative/due diligence, and debt and equity advising through acquisitions, as well as expanded service offerings. While maintaining a core focus on our private client segment, MMCC, through the IPA division, has commenced a focus on institutional clients. These specialized financing professionals work closely with IPA investment sales professionals across the country, supporting them and their clients in their financing needs as well as working directly with institutional clients.
We have established alliances with national capital sources that provide access to an assortment of highly competitive products including Fannie Mae, Freddie Mac and FHA. These alliances serve to expand the distribution network for each of our capital partners, while affording our financing professionals and clients with more favorable pricing and terms. We will continue to hire and acquire experienced financing professionals and companies to further grow our MMCC business, support the growth of our service platform and establish relationships with various capital sources. Further, our internally developed training programs are directed at enhancing the skill sets for our professionals, promoting the MMCC value proposition and increasing our internal capture rate with our investment sales brokerage clients and increasing activity with
non-brokerage
clients. As of December 31, 2021, we had 37 offices with financing professionals. We continue to capitalize on the synergies our financing professionals provide to our client-focused service platform with financing fees increasing 55.5% from $70.5 million in 2020 to $109.7 million in 2021.
Seasonality
There is seasonality in our real estate brokerage commissions and financing fees, which has generally caused our revenues, operating income, net income and cash flows from operating activities to be lower in the first half of the year and higher in the second half of the year, particularly in the fourth quarter. This historical trend could be disrupted either positively or negatively by major economic events, political events, natural disasters or pandemics such as the
COVID-19
pandemic, which may impact, among other things, investor sentiment for a particular property type or location, volatility in financial markets, current and future projections of interest rates, attractiveness of other asset classes, market liquidity and the extent of limitations or availability of capital allocations for larger property buyers. For a more detailed description of our seasonality, refer to Item 1A – “Risk Factors – External Business Risks –
Seasonal fluctuations and other market data in the
investment
real estate industry could adversely affect our business and make comparisons of our quarterly results difficult”
and Item 7 – “Management’s Discussion and Analysis of Financial Condition and Results of Operations – Overview –
Seasonality”
of this Annual Report on Form
10-K.
Competition
We compete in real estate brokerage and financing within the commercial real estate industry on a national, regional and local basis. Competition is based on a number of critical factors, including the quality and expertise of our investment sales and financing professionals, our execution skills, sales support, brand recognition and our business reputation. We primarily compete with other brokerage and financing firms that seek investment brokerage and financing business from real estate owners and investors. To a lesser extent, we compete with
 
12

Table of Contents
in-house
real estate departments, owners who may transact without using a brokerage firm, direct lenders, consulting firms and investment managers. Our relative competitive position also varies across geographies, property types and services. In investment brokerage, our competitors on a national level include CBRE Group Inc., Cushman & Wakefield plc, Colliers International Group, Inc., Jones Lang LaSalle Incorporated (“JLL”), Newmark Group Inc. and NAI Global. Competitors in financing services include institutional firms such as CBRE Group Inc., JLL, Cushman & Wakefield plc, Walker & Dunlop, NorthMarq Capital and a large group of local and regional mortgage banking firms. These investment brokerage firms mainly focus on larger sales and institutional investors and are not heavily concentrated in our largest market segment, which is the
$1-$10 million
private client market segment. However, there is crossover and competition between us and these firms. As a result of the fragmentation in the market, there are also numerous local and regional competitors in our markets, as well as competitors specializing in certain property types. Despite recent consolidation, the commercial real estate services industry remains highly fragmented and competitive.
Competition to attract and retain qualified professionals is also intense in each of our geographic regions and across all property types. We offer what we believe to be competitive compensation and support programs to our professionals. Our ability to continue to compete effectively will depend on retaining, motivating and appropriately compensating our professionals.
Technology and Security
Investments in Technology
We have a long-standing tradition of technological orientation, innovation and advancement. Our efforts include the development of proprietary applications designed to make the process of matching buyers and sellers faster and more efficient as well as
state-of-the-art
communication technology, infrastructure, internet presence and electronic marketing.
We have a proprietary internal marketing system, MNet, which allows our investment sales professionals to share listing information with investors across United States and Canada. MNet is an integrated tool that contains our entire property inventory, which allows our investment sales professionals to find listings with targeted criteria, such as searching by demographic data surrounding a target property, and to search for properties based on investors’ acquisition criteria. This system is an essential part of connecting buyers and sellers through our platform. Our policies require information sharing among our sales force, and the MNet system automates the process of matching each property we represent to the largest pool of qualified buyers tracked by our investment sales professionals. A part of MNet, called Buyer Needs, enables our sales force to register the investment needs of various buyers, which are then matched to our available inventory on a real-time basis.
A related application, MNet-Launch, is a system for automating the production of property marketing materials and launching marketing campaigns. MNet-Launch allows our investment sales professionals to create a listing proposal or marketing package, which automatically imports property information, data on comparable properties and other information, and then dynamically populates our
e-marketing,
print and internet media. This system allows our investment sales professionals to rapidly create professionally branded and designed materials for marketing properties on behalf of our clients in an efficient and timely manner. This
web-based
application improves efficiency by tightly integrating MNet data for transaction history, sales and rent comparables, and market insights that differentiate us in the marketplace. The proposals and marketing packages produced by MNet-Launch also deliver updated content and expanded demographic and financial analysis to better market those properties for our clients.
In 2020, we relaunched the Marcus & Millichap external website, bringing improved search capabilities and enhanced features for our investment sales professionals as well as our clients, via integrated deal room functionality. The website is designed not only to bring in new clients for our investment sales and financing professionals, but also to make our inventory of properties available for maximum exposure for our sellers, and to provide buyers with an opportunity to engage with our investment sales and financing professionals. We
 
13

Table of Contents
actively qualify leads generated from the contact forms and pass those leads to our agents via our customer relationship management platform. During 2021, our websites averaged approximately 158,000 new visitors per month and approximately 580,000 page views per month and also serve as a portal for delivery of online marketing materials and for deal collaboration.
Information Security and Risk Oversight
We maintain a comprehensive technology and information security program to ensure our technology platforms and systems are effective and prepared for information security risks, including regular oversight of our programs for security monitoring for internal and external threats to ensure the confidentiality and integrity of our information assets. We regularly perform evaluations of our information security program and continue to invest in our capabilities to keep the Company’s, our employees’, our independent contractors’ and our clients’ critical assets safe. Our Chief Information Officer is ultimately responsible for our information security program, which includes identifying threats, detecting potential attacks, and protecting all of our information assets. We have implemented information security monitoring capabilities designed to alert us to suspicious activity and developed an incident response program that includes periodic testing and is designed to restore business operations as quickly and as orderly as possible in the event of a breach. In addition, employees participate in ongoing mandatory trainings and receive communications regarding the cybersecurity environment to increase awareness throughout the firm. We also conduct enhanced information security trainings for specific specialized employee populations.
The Audit Committee of our Board of Directors, which is comprised entirely of independent directors, has oversight of the Company’s information security and other risks relevant to the Company’s information technology controls and security. Our Chief Information Officer will report security instances to the Audit Committee as they occur, if material, and provides an information technology and cybersecurity update to the Audit Committee on a quarterly basis.
Marketing and Branding
We were founded 51 years ago on the idea that when investment sales and financing professionals collaborate, we can optimize outcomes for our clients. Today, we are known for (i) providing investment brokerage and financing services through our proprietary marketing system, (ii) our policies and culture of information sharing and (iii) our
in-depth
investment brokerage training. All of this is executed under the supervision of a dedicated local, regional and national management team focused on client service and growing the firm.
In recent years we have also garnered recognition among institutions and larger private investors due to our integrated platform and ability to link private and institutional capital. We continue to strengthen and broaden our name recognition and credibility by executing a variety of marketing and branding strategies. Locally, our offices and investment sales and financing professionals engage in numerous events, direct mail campaigns and investor symposiums as well as participate in real estate conferences and organizations for various market segments and property types. Our regional managers and investment sales and financing professionals develop long-term client relationships and promote our brand through these activities.
Our research division produces nearly 1,700 publications and client presentations per year and is a leading source of information for the industry as well as the general business media. We provide research on 10 commercial property types covering: multifamily, retail, office, industrial, single-tenant net lease, seniors housing, self-storage, hospitality, medical office and manufactured housing, as well as capital markets/financing. This research includes analysis and forecasting of the economy, capital markets, real estate fundamentals, investment, pricing and yield trends. It is designed to assist investors in their strategy formation and decisions relating to specific assets and to help our investment sales and financing professionals develop and maintain relationships with clients.
 
14

Table of Contents
Our transactional and market research expertise result in significant print, radio, television and online media coverage including major national real estate publications such as Real Estate Forum, Multi-Housing News, Commercial Property Executive, Connect CRE, Wealth Management Real Estate as well as local market business journals and major national news outlets such as CNBC, The Wall Street Journal, Los Angeles Times, The New York Times, Fox Business, Bloomberg Businessweek, Forbes and numerous newspapers and trade publications in major metropolitan cities. Our CEO is frequently interviewed on national business channels, such as CNBC, Yahoo! Finance, TD Ameritrade, Fox Business, and Bloomberg, to discuss the commercial real estate market. We frequently have featured speaking roles in key regional and national industry events, we are regularly quoted in regional and national publications and media, and we deliver content directly to the real estate investment community through print, electronic publications and video. Nationally, our specialty groups and capital markets executives actively participate in various trade organizations, many of which focus on specific property types and provide an effective vehicle for branding and client relationship development.
We believe all of these activities create significant exposure and name recognition for our firm, which helps to build and foster strong, long-term client relationships.
Intellectual Property
We hold various trademarks and trade names, which include the “Marcus & Millichap” name. Although we believe our intellectual property plays a role in maintaining our competitive position in a number of the markets that we serve, we do not believe we would be materially, adversely affected by the expiration or termination of our trademarks or trade names or the loss of any of our other intellectual property rights other than the Marcus & Millichap name. With respect to the Marcus & Millichap name, we maintain trademark registrations for these service marks.
In addition to trade names, we have developed proprietary technologies for the provision of real estate investment services, such as MNet and MNet-Launch. We also offer proprietary research to clients through our research division. While we seek to secure our rights under applicable intellectual property protection laws in these and any other proprietary assets that we use in our business, we do not believe any of these other items of intellectual property are material to our business in the aggregate.
Government Regulation
We are subject to various real estate regulations, and we maintain real estate and other broker licenses in 47 states in the United States and four provinces in Canada. We are a licensed broker in each state in which we have an office, as well as those states where we frequently do business. We are also subject to numerous other federal, state and local laws and regulations that contain general standards for, and prohibitions on, the conduct of real estate brokers and sales associates, including agency duties, collection of commissions, telemarketing, advertising and consumer disclosures. One of our wholly owned subsidiaries is subject to certain human resource, data security, information technology and other compliance requirements due to its loan sale and consulting contracts with certain U.S. government agencies.
Employees and Investment Sales and Financing Professionals
Most of our investment sales professionals are classified as independent contractors under state and IRS guidelines. As such, we generally do not pay for the professionals’ expenses or benefits or withhold payroll taxes; rather they are paid from the commissions earned by us upon the closing of a transaction, and these individuals do not earn a salary from which taxes are withheld. Our investment sales and financing professionals hold applicable real estate sales licenses for their function and execute a “Salespersons Agreement” setting out the relationship between the professional and us. Each professional is obligated to provide brokerage services exclusively to us, and is provided access to our information technology, research and other support and business forms. Each professional generally reports on their activities to either the local regional manager, or in some cases, to product specialty managers.
 
15

Table of Contents
Environmental Sustainability
We recognize that operating our business in an environmentally sustainable manner is important to our success. For this reason, we are exploring ways to address the impact our business has on climate change, reduce carbon emissions, increase energy efficiency, reduce waste and limit our consumption of natural resources.
Climate Measures
As an organization, we have made a commitment to identifying, mitigating and managing risks associated with climate change. In addition, although we do not own or manage real property, we recognize the impact our activities, as well as those of our clients and vendors, may have on the planet and seek to reduce these impacts. We have enacted policies designed to manage our environmental impact and support our clients in their effort to achieve their own sustainability initiatives.
Resource Consumption
We are similarly focused on reducing our waste and energy usage. In addition to the use of reusable materials, the reduction of waste, and the smarter use of energy, we have pivoted to the use of technology such as online deal rooms and
e-signing
vendors to reduce paper waste and have partnered with
e-waste
recycling vendors to recycle our physical technology equipment or dispose of it in an environmentally sound manner.
We are committed to leasing office space in LEED Certified, Energy Star Rated and BOMA Best Gold buildings where practicable and are working with our current landlords to make environmentally sustainable improvements. Thirty-three of our current offices are located in such buildings, and we expect this percentage to increase as leases expire and new space is acquired. Additionally, we allow some remote work and have invested in best of class tools to enable our team to work at the highest levels outside the office, thereby helping to reduce the carbon footprint associated with a regular commute.
We plan to regularly evaluate our sustainability policies and practices to identify potential opportunities for further sustainability improvements and promote the sustainability initiatives of our team and vendors.
To learn more about our policies and practices regarding environmental sustainability, corporate social responsibility and human rights, please visit our website at
ir.MarcusMillichap.com/corporate-governance/governance-documents
. The content of the websites referred to in this Annual Report on Form 10-K are not incorporated by reference into this document.
Human Capital
We consider our relationship with our employees and independent contractors to be good, and we endeavor to offer reasonable and equitable employment opportunities to create a workplace that is welcoming, diverse, inclusive, equitable, safe, engaged and respectful of all people. We take recruiting, development, training, and the retention of talent very seriously to help drive long-term value. Our local management team members, as executives of the Company, are dedicated to recruiting, training, developing and supporting our investment sales and financing professionals. The majority of our local management teams are former senior investment sales professionals of the Company, who now focus on management, do not compete with our sales force and have an average of 13 years of real estate investment brokerage experience with our Company.
Recruiting
We seek to attract talent by offering
in-depth
training to our employees and independent investment sales and financing professionals, as well as competitive salaries and benefit programs for our employees and competitive commissions and business support for our independent investment sales and financing professionals, and through our reputation as the top broker within the
$1-$10 million
private client market segment.
 
16

Table of Contents
Development and Training
On the development and training front, our National Director of Development and Training was appointed in October 2021 to provide an even greater focus on the training and development of our investment sales and financing professionals. In addition, our regional managers provide extensive training/development to our salesforce, including classroom training, coaching, mentoring, workshops and working with and supporting our professionals. Their past experience as senior investment sales professionals plays a key role in developing new and experienced investment sales and financing professionals. They help our junior professionals to establish technical and client service skills as well as set up, develop and grow relationships with clients. Our training programs are further facilitated and supported by our learning management system and other professional development opportunities.
In 2021, we launched the William A. Millichap Fellowship Program, a comprehensive
two-year
training and development program designed to prepare participants for rewarding careers in commercial real estate. The Fellowship Program was launched in partnership with the Commercial Real Estate Women Network (“CREW Network”), a premier business network dedicated to transforming the commercial real estate industry by advancing women globally and Project Destined, a leading social impact platform that provides training in financial literacy, entrepreneurship, and real estate, and sponsors real estate internships in HBCUs and Public Universities. The Fellowship Program will initially be offered in 15 major cities within the U.S. and Canada. The first fellowship group commenced in February 2022. We believe our training, development and mentoring programs have helped differentiate us from our competitors and have helped us achieve better results for our clients.
In July 2021 and continuing into 2022, we have partnered with a leading analytics and advisory company to implement a robust leadership training program for our senior leadership including our regional managers. This program includes a leadership strengths assessment, a leadership development program, and an employee engagement survey. We also have a variety of training programs available to our employees through LinkedIn Learning, as well as other training resources.
Retaining Talent
We address retention by offering a sales awards program to recognize, retain and motivate our top investment sales and financing professionals; through our affiliation with International Council of Shopping Centers, National Association for Industrial and Office Parks and National Multifamily Housing Council; providing business support from our various functional groups; providing the opportunity to earn additional commissions after meeting certain annual financial thresholds for more senior investment sales and financing professionals; and providing competitive base salaries and incentive opportunities for employees.
Diversity, Equity and Inclusion
We strive to create a company culture that embraces, supports and promotes a diverse and inclusive workforce across all levels of the organization where people feel respected, valued, and heard. We are committed to and value an environment which recognizes and upholds the human rights of both our employees and our independent investment sales and financing professionals. To lead this effort, we have created the role of Head of Diversity, Equity and Inclusion, a Senior Director level position, reporting directly to our
C-Suite.
We continue to implement internal initiatives to increase diversity in our workforce and strengthen an inclusive culture. Among these initiatives are our sponsorships of CREW Network and Project Destined. We are currently a National Platinum Sponsor of CREW Network, as well as a local sponsor in Southern California with local board participation. An employee resource group, MMWomen, holds various networking and virtual events designed for female agents and originators who are interested in making connections across the firm, in addition to internal company events such as Fireside Chats with female leaders inside and outside the company.
 
17

Table of Contents
Communication and Engagement with Our Workforce
We also monitor and measure employee satisfaction and engagement through embedded management, human resource and legal departments. The Company is committed to maintaining an environment where open, honest communications are the expectation, not the exception, and where employees feel comfortable in approaching supervisors or management with questions and concerns including instances in which potential violations of standards or policies may have occurred. Employees have the ability to communicate directly with Human Resources representatives regularly. In addition, we offer employees several methods to advise the Company of any workplace or compliance issues, including a confidential reporting hotline monitored by the Company’s Compliance Officer. In 2022, we will be rolling out an Employee Engagement Committee as an additional communication resource and a method of supporting employee satisfaction. In addition, we have relied on an industry leading employee engagement survey as an additional resource for employee feedback and communication.
Adaptation and Resilience
The Company’s structure and technology investments allow for rapid adaptation to market and societal conditions. We believe our nimble and resilient workforce coupled with cutting edge technology minimizes the likelihood of any significant impact of business disruptions and system outages. When the pandemic required the immediate closure of offices, the Company’s workforce pivoted to remote work and continued without disruption or delay. Similarly, when the Company identified a cyber-attack on its systems in August 2021, we were able to continue to provide unfettered access to critical business tools and resources and resolved the cyber-attack without material impact to our business. As a result of the cyber-attack, we made significant upgrades to our security infrastructure, including deploying active security monitoring and response tools. As cybersecurity tools and security threats continue to evolve, the Company will remain vigilant and will continue to assess and upgrade its security measures to protect its technology and information.
Promoting Health, Wellbeing and Employee Safety
We are committed to protecting the health and safety of our employees, investment sales and financing professionals, clients and their families, while at the same time focusing on our clients’ success. In connection with the
COVID-19
pandemic, we have implemented measures such as increased sanitizing, physical distancing and remote work arrangements, with the goal of protecting our employees, investment sales and financing professionals and clients. We continue to follow the local guidelines in cities where our offices are located. We have taken multiple measures to support our investment sales and financing professionals’ ability to generate and execute business remotely. Such measures include multiple technological solutions, intensified internal training and education, as well as a significant increase in client outreach and investor education webcasts.
To support employee wellbeing, we have rolled out the Learn to Live program. These digital tools are available anywhere, anytime to help employees identify thoughts and behavior patterns that affect their emotional well-being and work through them. It provides tools and instruction to manage stress, depression, anxiety, substance use, and sleep issues. The program includes
one-on
one coaching, a support team to work through individual programs, and live and on demand webinars. We also provide “Wellness Resource Monthly Articles” to all employees, which are available on our intranet. Topics have included: healthy habits, burnout and resilience, financial wellness,
COVID-19
vaccine information, breast cancer awareness, suicide prevention, and alcohol and substance abuse. We also hold an annual fitness challenge in which all employees can participate.
Community Engagement and Empowerment
We have participated in and continue to be involved in ongoing community and charity events to promote community and employee engagement. Some of these events have included Marcus & Millichap’s ongoing partnership with Team Feed Corporate/Feeding America on the Million Meals Initiative with the goal of
 
18

Table of Contents
providing one million meals per year to people in need, employee participation in community volunteer events such as Habitat for Humanity and food banks, monetary donations to various veterans’ groups, and company matching of individual donations in times of natural disasters.
Key Metrics
As of December 31, 2021, we had 801 employees, consisting of 78 employees who serve as financing professionals, 39 employees in communications and marketing, 10 employees in research and 674 employees in management, support and general and administrative functions. As we noted above in “Growth Strategy,” a key factor to growing our business is hiring, training and developing investment sales and financing professionals.
As of December 31, 2021, we had 1,994 investment sales and financing professionals, a 4.9% decrease compared to December 31, 2020. The decline in the headcount of investment sales and financing professionals is attributable to a reduction of unproductive investment sales and financing professionals during the pandemic and a shift toward more experienced investment sales and financing professionals due to the challenging market environment brought on by the
COVID-19
pandemic.
Available Information
Our website address is
www.MarcusMillichap.com
. Information on our website does not constitute part of this report and inclusions of our internet address in this Annual Report on Form
10-K
are inactive textual references only. We are required to file current, annual and quarterly reports, proxy statements and other information required by the Exchange Act, with the SEC. We make available free of charge through a link provided on our website, our annual reports on Form
10-K,
quarterly reports on Form
10-Q,
current reports on Form
8-K,
proxy statements, Forms 3, 4 and 5 filed by or on behalf of directors, executive officers and certain large stockholders, and any amendments to those documents filed or furnished pursuant to the Exchange Act. Such reports are available as soon as reasonably practicable after they are filed with the SEC.
The SEC also maintains a website that contains reports, proxy and information statements and other information about us that we file electronically with the SEC at
www.sec.gov
.
We also make available on our website and will provide print copies to stockholders upon request, (i) our corporate governance guidelines, (ii) our code of ethics, and (iii) charters of the audit, compensation, nominating and corporate governance and executive committees of our board of directors.
From time to time, we may announce key information in compliance with Regulation FD by disclosing that information on our website.
Item 1A. Risk Factors
Investing in our securities involves a high degree of risk. You should consider carefully the following risk factors and the other information in this Annual Report on Form
10-K,
including our consolidated financial statements and related notes, before making any investment decisions regarding our securities. If any of the following risks actually occur, our business, financial condition and operating results could be adversely affected. As a result, the trading price of our securities could decline, and you may lose part or all of your investment.
 
19

Table of Contents
Overview
We are impacted by and manage many risk factors detailed below affecting our business including External Business Risks, Human Resource and Personnel Risks, Internal Business Risks, Technology and Cybersecurity Risks, Investment Risks, Risks Related to Our Founder and General Risks as well as the risks discussed in “Management’s Discussion and Analysis of Financial Position and Results of Operations” and “Quantitative and Qualitative Disclosures About Market Risk.” Many of these factors described below in External Business Risks are outside of our control. In addition, we are a personnel and relationship intensive business rather than a capital-intensive business. While all the risk factors discussed below have the potential to negatively impact our business, the most significant risks facing us are the risks associated with general economic conditions and commercial real estate market conditions and our ability to attract and retain qualified and experienced managers and investment sales and financing professionals.
External Business Risks
The
COVID-19
pandemic has affected and could continue to adversely affect how we operate our business, and the duration and extent to which it will impact our future results of operations and overall financial performance is unknown.
The
COVID-19
pandemic has been and continues to be a prolonged widespread global health crisis that has adversely affected and could continue to adversely affect the broader economies, the capital markets, how we operate our business and the overall demand for our services.
Government imposed restrictions, including the state, county and local level restrictions on certain types of businesses that may not allow them to operate normally, intended to slow the community spread of
COVID-19
have, and may continue to affect our clients or potential clients’ ability or willingness to purchase properties; delay the closing of real estate sales and financing transactions; increase the borrowing cost and reduce the availability of debt financing; impact our ability to provide or deliver services to our clients or potential clients; and/or temporarily delay our expansion efforts. In addition, uncertainties regarding the potential impact of new
COVID-19
variants, general population vaccination rates and vaccine mandates on our workforce, and the resumption of any new state, county or local level restrictions, could materially affect our future sales, operating results, liquidity and overall financial performance due to, among other factors:
 
   
Any impairment in value of our investments in marketable debt securities,
available-for-sale
and tangible or intangible assets, which could be recorded as a result of weaker economic conditions.
 
   
A potential negative impact on the health of our employees and investment sales and financing professionals, particularly if a significant number of them are impacted, could result in a deterioration in our ability to ensure business continuity during a disruption.
 
   
If significant portions of our workforce are unable to work effectively, including because of government restrictions, office closures, ineffective remote work arrangements or technology failures or limitations, our operations would be adversely impacted.
The long-term potential economic impact of a pandemic may be difficult to assess or predict. A long-term recession or long-term market correction could have a long-term impact on the flow of capital to the commercial real estate market and/or the willingness of investors to invest in or sell commercial real estate. This may adversely impact the demand for our services as well as the value of our common stock and our access to capital.
Please see Part II, Item 7 – “Management’s Discussion and Analysis of Financial Condition and Results of Operations” for a more detailed discussion of the potential impact of the
COVID-19
pandemic and associated economic disruptions.
 
20

Table of Contents
General economic conditions and commercial real estate market conditions have had and may in the future have a negative impact on our business.
We may be negatively impacted by periods of economic downturns, recessions and disruptions in the capital markets; credit and liquidity issues in the capital markets, including international, national, regional and local markets; tax and regulatory changes and corresponding declines in the demand for commercial real estate investment and related services. Historically, commercial real estate markets and, in particular, the U.S. commercial real estate market, have tended to be cyclical and related to the flow of capital to the sector, the condition of the economy as a whole and to the perceptions and confidence of market participants to the economic outlook. Cycles in the real estate markets may lead to similar cycles in our earnings and significant volatility in our stock price. Further real estate markets may “lag” behind the broader economy such that even when underlying economic fundamentals improve in a given market, additional time may be required for these improvements to translate into strength in the real estate markets. The “lag” may be exacerbated when banks delay their resolution of commercial real estate assets whose values are less than their associated loans.
Negative economic conditions, changes in interest rates, credit and the availability of capital, both debt and/or equity, disruptions in capital markets, uncertainty of the tax and regulatory environment and/or declines in the demand for commercial real estate investment and related services in international and domestic markets or in significant markets in which we do business, have had and could have in the future a material adverse effect on our business, results of operations and/or financial condition. In particular, the commercial real estate market is directly impacted by (i) the lack of debt and/or equity financing for commercial real estate transactions, (ii) increased interest rates and changes in monetary policies by the U.S. Federal Reserve, (iii) changes in the perception that commercial real estate is an accepted asset class for portfolio diversification, (iv) changes in tax policy affecting the attractiveness of real estate as an investment choice, (v) changes in regulatory policy impacting real estate development opportunities and capital markets, (vi) slowdowns in economic activity that could cause residential and commercial tenant demand to decline, and (vii) declines in the regional or local demand for commercial real estate, or significant disruptions in other segments of the real estate markets could adversely affect our results of operations. Any of the foregoing would adversely affect the operation and income of commercial real estate properties.
These and other types of events could lead to a decline in transaction activity as well as a decrease in property values which, in turn, would likely lead to a reduction in brokerage commissions and financing fees relating to such transactions. These effects would likely cause us to realize lower revenues from our transaction service fees, including brokerage commissions, which fees usually are tied to the transaction value and are payable upon the successful completion of a particular transaction. Such declines in transaction activity and value would likely also significantly reduce our financing activities and revenues.
Fiscal uncertainty, significant changes and volatility in the financial markets and business environment, and similar significant changes in the global, political, security and competitive landscape, make it increasingly difficult for us to predict our revenue and earnings into the future. As a result, any revenue or earnings projections or economic outlook which we may give, may be affected by such events or may otherwise turn out to be inaccurate.
Our business has been and may in the future be adversely affected by restrictions in the availability of debt or equity capital as well as a lack of adequate credit and the risk of deterioration of the debt or credit markets and commercial real estate markets.
Restrictions on the availability of capital, both debt and/or equity, can create significant reductions in the liquidity and flow of capital to the commercial real estate markets. Severe restrictions in debt or equity liquidity as well as the lack of the availability of credit in the markets we service can significantly reduce the volume and pace of commercial real estate transactions. These restrictions can also have a general negative effect upon commercial real estate prices themselves. Our business is particularly sensitive to the volume of activity and
 
21

Table of Contents
pricing in the commercial real estate market. This has had, and may have in the future, a significant adverse effect on our business.
We cannot predict with any degree of certainty the magnitude or duration of developments in the credit markets and commercial real estate markets as it is inherently difficult to make accurate predictions with respect to such macroeconomic movements that are beyond our control. This uncertainty limits our ability to plan for future developments. In addition, uncertainty regarding market conditions may limit the ability of other participants in the credit markets or commercial real estate markets to plan for the future. As a result, market participants may act more conservatively than they might in a stabilized market, which may perpetuate and amplify the adverse developments in the markets we service. While business opportunities may emerge from assisting clients with transactions relating to distressed commercial real estate assets, there can be no assurance that the volume of such transactions will be sufficient to meaningfully offset the declines in transaction volumes within the overall commercial real estate market.
Our loss sharing indemnification obligation pursuant to our agreement with M&T Realty Capital Corporation may adversely impact our results of operations, cash flows and/or our financial condition.
In October 2021, MMCC, entered into an agreement with M&T Realty Capital, which has a DUS Agreement with Fannie Mae and is an approved lender for Freddie Mac’s Conventional and Targeted Affordable Housing loans. M&T Realty originates, underwrites, closes and services loans under the DUS Agreement and is subject to indemnifying Fannie Mae for of a portion of the risk of loss for those loans. Under the agreement with M&T Realty, MMCC provides loan opportunities to M&T Realty, and for those loans closed under the DUS Agreement by M&T Realty, MMCC has the option to assume a portion of the indemnification obligation of M&T Realty to Fannie Mae. We may need to secure additional sources of financing to satisfy our loss sharing indemnification obligations under these programs. We cannot make any assurances that such financing would be available on attractive terms, if at all, or that any indemnification obligations might be material or would not have an adverse effect on our business, financial condition and results of operations.
We have numerous significant competitors and potential future competitors, some of which may have greater resources than we do, and we may not be able to continue to compete effectively.
We compete in investment sales and financing within the commercial real estate industry. Our investment sales focus is on the private client market segment, which is highly fragmented. The fragmentation of our market makes it challenging to effectively gain market share. While we may have a competitive advantage over other national firms in the private client market segment, we also face competition from local and regional service providers who have existing relationships with potential clients. Furthermore, transactions in the private client market segment are smaller than many other commercial real estate transactions. Although the brokerage commissions in this segment are generally a higher percentage of the sales price, the smaller size of the transactions requires us to close many more transactions to sustain revenues. If the commission structure or the velocity of transactions were to change, we could be disproportionately affected by changes compared to other companies that focus on larger transactions, institutional clients and other segments of the commercial real estate market.
There is no assurance that we will be able to continue to compete effectively, maintain our current fee arrangements with our private clients, maintain current margin levels or counteract increased competition. The services we provide to our clients are highly competitive on a national, regional and local level. Depending on the geography, property type or service, we face competition from, including, but not limited to, commercial real estate service providers,
in-house
real estate departments, private owners and developers, commercial mortgage servicers, institutional lenders, research and consulting firms, and investment managers, some of whom are clients and many of whom may have greater financial resources than we do. In addition, future changes in laws and regulations could lead to the entry of other competitors. Many of our competitors are local, regional or national firms. Although most are substantially smaller than we are, some of these competitors are larger on a
 
22

Table of Contents
local, regional or national basis, and we believe more national firms are exploring entry into or expansion in the
$1-$10 million
private client market segment. We may face increased competition from even stronger competitors in the future due to a trend toward acquisitions and consolidation. We are also subject to competition from other large national and multi-national firms as well as regional and local firms that have similar service competencies to ours. Our existing and future competitors may choose to undercut our fees, increase the levels of compensation they are willing to pay to their employees and investment sales and financing professionals. This could result in these competitors recruiting our employees and investment sales and financing professionals, cause us to increase our level of compensation or commission necessary to retain employees or investment sales and financing professionals, and/or require us to recruit new employees or investment sales and financing professionals. These occurrences could cause our revenue to decrease, and/or expenses to increase, which could have an adverse effect on our business, financial condition and results of operations.
Our brokerage operations are subject to geographic and commercial real estate market risks, which could adversely affect our revenues and profitability.
Our real estate brokerage offices are located in and around large metropolitan areas as well as
mid-market
regions throughout the United States and Canada. Local and regional economic conditions in these locations could differ materially from prevailing conditions in other parts of the country. We realize more of our revenues in California than any other state. In 2021, we earned approximately 27% of our revenues from offices in California. In particular, as a result of this concentration, we are subject to risks related to the California economy and real estate markets more than in other geographic markets. In addition to economic conditions, this geographic concentration means that California-specific legislation, California- specific
COVID-19
restrictions, taxes and regional disasters, such as earthquakes and wildfires as well as the impact of climate change, could disproportionately affect us. A downturn in investment real estate demand or economic conditions in California and other regions could result in a further decline in our total gross commission income which could have an adverse effect on our business, financial condition and results of operations.
Seasonal fluctuations and other market data in the investment real estate industry could adversely affect our business and make comparisons of our quarterly results difficult.
Our revenue and profits have historically tended to be significantly higher in the second half of each year than in the first half of the year. This is a result of a general focus in the real estate industry on completing or documenting transactions by calendar year end and because certain of our expenses are relatively constant throughout the year. This historical trend can be disrupted both positively and negatively by major economic, regulatory or political events impacting investor sentiment for a particular property type or location, current and future projections of interest rates and tax rates, attractiveness of other asset classes, market liquidity and the extent of limitations or availability of capital allocations for larger institutional buyers, to name a few. As a result, our historical pattern of seasonality may or may not continue to the same degree experienced in the prior years and may make it difficult to determine, during the course of the year, whether planned results will be achieved, and thus to adjust to changes in expectations.
A change in the tax laws relating to like-kind exchanges could adversely affect our business and the value of our stock.
Section 1031 of the Internal Revenue Code of 1986, as amended (the “Code”), provides for
tax-free
exchanges of real property for other real property. Legislation has been proposed on several occasions that would repeal or restrict the application of Section 1031. If
tax-free
exchanges under Section 1031 were to be limited or unavailable, our clients or prospective clients may decide not to purchase or sell property that they would have otherwise purchased or sold due to the tax consequences of the transaction, thus reducing the commissions we would have otherwise received. Any repeal or significant change in the tax rules pertaining to like-kind exchanges could have a substantial adverse impact on our business, financial condition, results of operations, and the value of our stock.
 
23

Table of Contents
A change in the tax laws could adversely affect our business and value of our stock.
Changes in tax laws can impact investors’ perceived value of real estate, timing of transactions and perception of real estate as favorable investment. As a result, such changes may increase or decrease investors’ desire to engage in real estate transactions, which could have an unfavorable impact on our business, financial condition, results of operations, and the value of our stock. Changes in tax laws in the various jurisdictions in which we operate may also impact the taxes we are required to pay, our ability to transact business in such jurisdictions, and may make operating in these jurisdictions unprofitable and unfavorably impact our results of operations and ability to execute our growth plans.
The Internet could devalue our information services and lead to reduced client relationships, which could reduce the demand for our services.
The dynamic nature of the Internet, which has substantially increased the availability and transparency of information relating to commercial real estate listings and transactions, could change the way commercial real estate transactions are done. This has occurred to some extent in the residential real estate market as online brokerage and/or auction companies have eroded part of the market for traditional residential real estate brokerage firms. The proliferation of large amounts of data on the Internet could also devalue the information that we gather and disseminate as part of our business model and may harm certain aspects of our investment brokerage business in the event that principals of transactions prefer to transact directly with each other. Further, the rapid dissemination and increasing transparency of information, particularly for public companies, increases the risks to our business that could result from negative media or announcements about ethics lapses, improper behavior or other operational problems, which could lead clients to terminate or reduce their relationships with us.
New laws or regulations or changes in existing laws or regulations or the application thereof could adversely affect our businesses, financial condition, results of operations and prospects.
We are subject to numerous federal, state, local and foreign regulations specific to the services we perform in our business, as well as laws of broader applicability, such as securities, financial services and employment laws. In general, the brokerage of real estate transactions requires us to maintain applicable licenses where we perform these services. If we fail to maintain our licenses or conduct these activities without a license, or violate any of the regulations covering our licenses, we may be required to pay fines (including treble damages in certain states) or return commissions received or have our licenses suspended or revoked. We could also be subject to disciplinary or other actions in the future due to claimed noncompliance with these regulations, which could have a material adverse effect on our operations and profitability.
Our business is also governed by various laws and regulations, limiting the manner in which prospective clients may be contacted, including federal and state “Do Not Call” and “Do Not Fax” regulations. We may be subject to legal claims and governmental action if we are perceived to be acting in violation of these laws and regulations. We may also be subject to claims to the extent individual employees or investment sales and financing professionals breach or fail to adhere to company policies and practices designed to maintain compliance with these laws and regulations. The penalties for violating these laws and regulations, can be material, and could result in changes in which we are able to contact prospective clients.
As the size and scope of commercial real estate transactions have increased significantly during the past several years, both the difficulty of ensuring compliance with numerous licensing regimes and the possible loss resulting from
non-compliance
have increased. New or revised legislation or regulations applicable to our business, both within and outside of the United States, as well as changes in administrations or enforcement priorities may have an adverse effect on our business. Such new or revised legislation or regulations applicable to our business may impact transaction volumes and values, increase the costs of compliance or prevent us from providing certain types of services in certain jurisdictions or in connection with certain transactions or clients. For example, legislation which limits or prohibits dual agency, could have an adverse impact on our revenues.
 
24

Table of Contents
We are unable to predict how any of these new laws, rules, regulations and proposals will be implemented or in what form, or whether any additional or similar changes to laws or regulations, including the interpretation or implementation thereof, will occur in the future. Risks of legislative changes, including as a result of interpretive guidance or other directives from the current administration, and new laws, regulations and interpretations may also come into effect. The impact of any new or revised legislation or regulations under the current administration is unknown. Any such action could affect us in substantial and unpredictable ways and could have an adverse effect on our business, financial condition and results of operations.
Human Resource and Personnel Risks
If we are unable to attract and retain qualified and experienced managers, investment sales and financing professionals, our growth may be limited, and our business and operating results could suffer.
Our most important asset is people, and our continued success is highly dependent upon the efforts of our managers and investment sales and financing professionals. If these managers or investment sales and financing professionals depart, we will lose the substantial time and resources we have invested in training and developing those individuals and our business, financial condition and results of operations may suffer. Additionally, such departures may have a disproportionate adverse effect on our operations if our most experienced investment sales and financing professionals do not remain with us or if departures occur in geographic areas where substantial amounts of our real estate brokerage commissions and financing fee revenues are generated.
Our competitors frequently attempt to recruit our investment sales and financing professionals or change commission structures in the marketplace. For a variety of reasons, the exclusive independent contractor and employment arrangements we have entered into or may enter into with these professionals may not prevent these professionals from departing and competing against us. As the majority of our investment sales and financing professionals are independent contractors and we currently do not have employment agreements with most key employees, there is no assurance that we will be able to retain their services. Similarly, most key employees in sales leadership roles, which includes our experienced managers, currently do not have employment agreements and there is no assurance that we will be able to retain their services.
An increasing component of our growth has also occurred through the recruiting, training and retention of key experienced investment sales and financing professionals. Any future growth through attracting these types of professionals will be partially dependent upon the continued availability of qualified candidates fitting the culture of our firm at reasonable terms and conditions. However, our competitors continue to offer lucrative compensation packages and commission splits to these key experienced professionals that we may not be able to match or exceed while also remaining profitable. As a result, the professionals whom we would like to recruit or retain may not agree to terms and conditions acceptable to us. In addition, as the recruitment and retention of what appear to be the key experienced professionals may require substantial investment, such as lucrative compensation packages, support agreements, and commission splits, this investment involves risks that the persons acquired will not perform in accordance with expectations and that business judgments concerning the value, strengths and weaknesses of persons recruited will prove incorrect, and therefore may not have been worth the substantial investment.
If we lose the services of our executive officers or certain other members of our senior management team, we may not be able to execute our business strategy.
Our success depends in a large part upon the continued service of our senior management team, who are important to our vision, strategic direction and culture. Our current long-term business strategy was developed in large part by our senior-level management team, some of whom have recently retired or will be transitioning to new positions, and depends in part on their skills and knowledge to implement. Our focus on new growth and investment initiatives may require additional management expertise to successfully execute our strategy. We may not be able to offset the impact on our business of the loss of the services of our senior-level management team or other key officers or employees or be able to recruit additional or replacement talent, which could negatively impact our business, financial condition and results of operations.
 
25

Table of Contents
Our business could be hurt if we are unable to retain our business philosophy and culture of information-sharing and efforts to retain our philosophy and culture could adversely affect our ability to maintain and grow our business.
Our policy of information-sharing, matching properties with large pools of investors and the emphasis that we place on our clients, our people and our culture define our business philosophy and differentiates our services. Various factors could adversely affect this culture. If we do not continue to develop and implement the right processes and tools to manage our changing enterprise and maintain this culture, our ability to compete successfully and achieve our business objectives could be impaired, which could negatively impact our business, financial condition and results of operations.
The concentration of sales among our top investment sales and financing professionals could lead to losses if we are unable to retain them.
Our most successful investment sales and financing professionals are responsible for a significant percentage of our revenues. They also serve as mentors and role models, and provide invaluable training for younger professionals, which is an integral part of our culture. This concentration among our top investment sales and financing professionals of real estate brokerage commissions and financing fees revenues can lead to greater and more concentrated risk of loss if we are unable to retain them, and could have a material adverse impact on our business and financial condition. Furthermore, many of our investment sales and financing professionals work in teams. If a team leader or manager leaves our Company, his or her team members may leave with the team leader.
Most of our sales professionals are independent contractors, not employees, and if laws, regulations or rulings mandate that they be employees, our business would be adversely impacted.
Most of our investment sales professionals are retained as independent contractors, and we are subject to the Internal Revenue Service regulations and applicable state law guidelines regarding independent contractor classification. These regulations and guidelines are subject to judicial and agency interpretation, and it could be determined that the independent contractor classification is inapplicable to some or all of our investment sales professionals. Further, if legal standards for classification of these investment sales professionals as independent contractors change or appear to be changing, it may be necessary to modify our compensation or commission structure for these investment sales professionals in some or all of our markets, including paying additional compensation or reimbursing expenses. If we are forced to classify these investment sales professionals as employees, we would also become subject to laws regarding employee classification and compensation, and to claims regarding overtime, minimum wage, and meal and rest periods. We could also incur substantial costs, penalties and damages due to future challenges by current or former investment sales professionals to our classification or compensation practices. Any of these outcomes could result in substantial costs to us, could significantly impair our financial condition and our ability to conduct our business as we choose, and could damage our reputation and impair our ability to attract clients and investment sales and financing professionals.
Fraud, or theft, which is difficult to detect and deter, could harm us by impairing our ability to attract and retain clients and subjecting us to significant legal liability and reputational harm.
If our employees or investment sales and financing professionals engage in misconduct, our business could be adversely affected. It is not always possible to deter misconduct, and the precautions we take to deter and prevent this activity may not be effective in all cases. If our employees or investment sales and financing professionals were to engage in unethical business practices, improperly use, disseminate, fail to disseminate or disclose information provided by our clients, we could be subject to regulatory sanctions, suffer serious harm to our reputation, financial position and current client relationships and significantly impair our ability to attract future clients. These events could adversely affect our business, financial condition and results of operations. To the extent any fraud or theft of funds or misconduct result in losses that exceeds our insurance coverage, our business could be materially adversely affected.
 
26

Table of Contents
Internal Business Risks
We may fail to successfully differentiate our brand from those of our competitors, which could adversely affect our revenues.
The value of our brand and reputation is one of our most important assets. An inherent risk in maintaining our brand is we may fail to successfully differentiate the scope and quality of our service and product offerings from those of our competitors, or we may fail to sufficiently innovate or develop improved products or services that will be attractive to our clients. Additionally, given the rigors of the competitive marketplace in which we operate, there is the risk we may not be able to continue to find ways to operate more productively and more cost-effectively, including by achieving economies of scale, or we will be limited in our ability to further reduce the costs required to operate on a nationally coordinated platform.
Our attempts to expand our services and businesses may not be successful and we may expend significant resources without corresponding returns.
We intend to expand our specialty groups, particularly multi-tenant retail, office, industrial and hospitality, as well as various niche segments, including multifamily tax credit, affordable housing, student housing, manufactured housing, seniors housing and self-storage. We also plan to grow our financing services and commercial mortgage servicing provided through our subsidiary, Marcus & Millichap Capital Corporation. We expect to incur expenses relating to acquisitions, recruitment, training, and expanding our markets and services. The planned expansion of services and platforms requires significant resources, and there can be no assurance we will compete effectively, attract or train a sufficient number of professionals to support the expansion, or operate these businesses profitably. We may incur significant expenses for these plans without corresponding returns, which would harm our business, financial condition and results of operations.
If we experience significant growth in the future, such growth may be difficult to sustain and may place significant demands on our administrative, operational and financial resources.
If we experience significant growth in the future, such growth could place additional demands on our resources and increase our expenses, as we will have to commit additional management, operational and financial resources to maintain appropriate operational and financial systems to adequately support expansion. There can be no assurance we will be able to manage our expanding operations effectively or we will be able to maintain or accelerate our growth, and any failure to do so could adversely affect our ability to generate revenue and control our expenses, which could adversely affect our business, financial condition and results of operations. Any failure to manage our growth could adversely affect our ability to generate revenue and control our expenses, which could adversely affect our business, financial condition and results of operations. Moreover, we may have to delay, alter or eliminate the implementation of certain aspects of our growth strategy due to events beyond our control, including, but not limited to, changes in general economic conditions and commercial real estate market conditions. Such delays or changes to our growth strategy may adversely affect our business.
Our growth plan includes completing acquisitions, which may or may not happen depending on the acquisition opportunities that are available in the marketplace.
Our ability to grow by acquiring companies or assets and by making investments to complement our existing businesses will depend upon the availability of suitable acquisition candidates. If we are unable to find suitable acquisition candidates, if we are unable to attract the interest of such candidates, or if we are unable to successfully negotiate and complete such acquisitions, that could limit our ability to grow.
 
27

Table of Contents
If we acquire businesses in the future, we may experience high transaction and integration costs, the integration process may be disruptive to our business and the acquired businesses may not perform as we expect.
From time to time, we pursue strategic acquisitions to add and enhance our real estate brokerage and financing service offerings. The companies we have acquired have generally been regional or specialty firms that expand our network of investing and financing professionals and/or provide further diversification to our brokerage and financing services. Our acquisition structures may include deferred and/or contingent consideration payments in future periods that are subject to the passage of time or achievement of certain financial performance metrics and other conditions. Acquisitions also frequently involve significant costs related to integrating culture, information technology, accounting, reporting and management services and rationalizing personnel levels. If we are unable to fully integrate the culture, accounting, reporting and other systems of the businesses we acquire, we may not be able to effectively manage them, and our financial results may be materially adversely affected.
In addition, the acquisitions of businesses involve risks that the businesses acquired will not perform in accordance with expectations, that the expected synergies associated with acquisitions will not be achieved, that we will experience attrition from professionals licensed or associated with the acquired companies and that business judgments concerning the value, strengths and weaknesses of the businesses acquired will prove incorrect, which could have an adverse effect on our business, financial condition and results of operations.
A majority of our revenue is derived from transaction fees, which are not long-term contracted sources of recurring revenue and are subject to external economic conditions and declines in those engagements could have a material adverse effect on our financial condition and results of operations.
We historically have earned principally all of our revenue from real estate brokerage transactions and financing fees. We expect that we will continue to rely heavily on revenue from these sources for substantially all of our revenue for the foreseeable future. A decline in number of transactions completed or in the value of the commercial real estate we sell could significantly decrease our revenues, which would adversely affect our business, financial condition and results of operations.
If we are unable to retain existing clients and develop new clients, our financial condition may be adversely affected.
We are substantially dependent on long-term client relationships and on revenue received for services provided for them. Our listing agreements generally expire within six months and depend on the cooperation of the client during the pendency of the agreement, as is typical in the industry. In this competitive market, if we are unable to maintain these relationships or are otherwise unable to retain existing clients and develop new clients, our business, results of operations and/or financial condition may be materially adversely affected. Historically, a global economic downturn and weaknesses in the markets in which our clients and potential clients compete have led to a lower volume of transactions and fewer real estate clients generally, which makes it more difficult to maintain existing and establish new client relationships. These effects could increase again in the wake of the continuing political and economic uncertainties in the United States and in other countries.
We may face significant liabilities and/or damage to our professional reputation as a result of litigation allegations and negative publicity.
As a licensed real estate broker, we and our licensed professionals and brokers are subject to regulatory due diligence, disclosure and
standard-of-care
obligations. The actual or perceived failure to fulfill these obligations could subject us or our professionals and brokers to litigation from parties who attempted to or in fact financed, purchased or sold properties that we or they brokered, managed or had some other involvement. We could become subject to claims by those who either wished to participate or did participate in real estate transactions alleging that we did not fulfill our regulatory, contractual or other legal obligations. We also face potential conflicts of interest claims when we represent both the buyer and the seller in a transaction.
 
28

Table of Contents
We depend on our business relationships and our reputation for integrity and high-caliber professional services to attract and retain clients. As a result, allegations by private litigants or regulators, whether the ultimate outcome is favorable or unfavorable to us, as well as negative publicity and press speculation about us or our investment activities, whether or not valid, may harm our reputation and damage our business prospects. In addition, if any lawsuits were brought against us and resulted in a finding of substantial legal liability, it could materially, adversely affect our business, financial condition or results of operations or cause significant reputational harm to us, which could materially impact our business.
Some of these litigation risks may be mitigated by the commercial insurance we maintain in amounts we believe are appropriate. However, in the event of a substantial loss, our commercial insurance coverage and/or self-insurance reserve levels might not be sufficient to pay the full damages, or the scope of available coverage may not cover certain types of claims. Further, the value of otherwise valid claims we hold under insurance policies could become uncollectible in the event of the covering insurance company’s insolvency, although we seek to limit this risk by placing our commercial insurance only with highly-rated companies. Any of these events could negatively impact our business, financial condition or results of operations.
Failure to appropriately deal with actual or perceived conflicts of interest could adversely affect our businesses.
Outside of our employees and investment sales and financing professionals, our reputation is one of our most important assets. As we have expanded the scope of our services, we increasingly have to address potential, actual or perceived conflicts of interest relating to the services we provide to our existing and potential clients. For example, conflicts may arise between our position as an advisor to both the buyer and seller in commercial real estate sales transactions or in instances when a potential buyer requests that we represent them in securing the necessary capital to acquire an asset we are selling for another client or when a capital source takes an adverse action against an owner client that we are advising in another matter. From time to time, we also advise or represent entities and parties affiliated with us in commercial real estate transactions which also involve clients unaffiliated with us. In this context, we may be subject to complaints or claims of a conflict of interest. While we believe we have attempted to adopt various policies, controls and procedures to address or limit actual or perceived conflicts, these policies and procedures may not be adequate, require excessive expenditures and may not be adhered to by our employees. Appropriately dealing with conflicts of interest is complex and difficult and our reputation could be damaged and cause us to lose existing clients or fail to gain new clients if we fail, or appear to fail, to deal appropriately with conflicts of interest, which could have an adverse effect on our business, financial condition and results of operations.
Technology and Cybersecurity Risks
If we do not respond to technological innovations or changes or upgrade our technology systems, our growth prospects and results of operations could be adversely affected.
To remain competitive, we must continue to enhance and improve the functionality, features and security of our technology infrastructure. Infrastructure upgrades may require significant capital investment outside of the normal course of business. In the future, we will likely need to improve and upgrade our technology, database systems and network infrastructure in order to allow our business to grow in both size and scope. Without such improvements, our operations might suffer from unanticipated system disruptions, slow performance or unreliable service levels, any of which could negatively affect our ability to provide rapid customer service. We may face significant delays in introducing new services, investment sales professional tools and enhancements. Moreover, if we do not keep pace with the rapid innovations and changes taking place in information technology in our industry, we could be at a competitive disadvantage. If competitors introduce new products and services using new technologies, our proprietary technology and systems may become less competitive, and our business may be harmed. In addition, the expansion and improvement of our systems and infrastructure may require us to commit substantial financial, operational and technical resources, with no assurance that our business will improve.
 
29

Table of Contents
Interruption, data security breaches, or failure of our information technology, communications systems or data services could hurt our ability to effectively provide our services, which could damage our reputation and harm our operating results.
Our business requires the continued operation of information technology and communication systems and network infrastructure. Our ability to conduct our business may be adversely impacted by disruptions or breaches to these systems or infrastructure. Our information technology and communications systems are vulnerable to damage or disruption from fire, power loss, telecommunications failure, system malfunctions, computer viruses, third-party misconduct or penetration and criminal acts, natural disasters such as hurricanes, earthquakes, wildfires and floods, acts of war or terrorism, or other events which are beyond our control. For example, in August 2021, we were subject to a cybersecurity attack on our information technology systems. We immediately engaged cybersecurity experts to secure and restore all essential systems and were able to do so with only minimal disruption to our business. There are no guarantees, however, that if we were to experience another cybersecurity attack on our information technology systems, we would be able restore all essential systems with only minimal disruption to our business again or that we would not incur significant expense in connection with an attack.
In addition, the operation and maintenance of these systems and networks is, in some cases, dependent on third-party technologies, systems and service providers for which there is no certainty of uninterrupted availability. Any of these events could cause system interruption, delays, and loss of critical data or intellectual property (such as our client lists and information, business methods and research) and may also disrupt our ability to provide services to or interact with our clients, and we may not be able to successfully implement contingency plans that depend on communication or travel. We have business continuity plans and backup systems to reduce the potentially adverse effect of such events, but our business continuity planning may not be sufficient and cannot account for all eventualities. A catastrophic event that results in the destruction or disruption of any of our data centers or our critical business or information technology systems could severely affect our ability to conduct normal business operations and, as a result, our future operating results could be adversely affected. Our business relies significantly on the use of commercial real estate data. We produce much of this data internally, but a significant portion is purchased from third-party providers for which there is no certainty of uninterrupted availability. A disruption of our ability to provide data to our professionals and/or clients could damage our reputation, and our operating results could be adversely affected.
Failure to maintain the security of our information and technology networks, including personally identifiable and client information could adversely affect us.
Security breaches and other disruptions could compromise our information and expose us to liability, which could cause our business and reputation to suffer. In the ordinary course of our business, we collect and store sensitive data, including our proprietary business information and intellectual property and that of our clients and personally identifiable information of our employees and contractors, in our data centers and on our networks. The secure processing, maintenance and transmission of this information is critical to our operations. Despite our security measures, our information technology and infrastructure have been subject to, and may in the future be vulnerable to various cyber-attacks, such as hacking, spoofing and phishing attacks and ransomware attacks, or our systems may be breached due to employee error, malfeasance or other disruptions. A significant actual or potential theft, loss, fraudulent use or misuse of client, employee or other personally identifiable data, whether by third parties or as a result of employee malfeasance or otherwise,
non-compliance
with our contractual or other legal obligations regarding such data or a violation of our privacy and security policies with respect to such data could result in significant costs, fines, litigation or regulatory actions against us. Such an event could additionally disrupt our operations and the services we provide to clients, damage our reputation, and cause a loss of confidence in our services, which could adversely affect our business, revenues and competitive position. Additionally, we increasingly rely on third-party data storage providers, including cloud storage solution providers, resulting in less direct control over our data. Such third parties may also be vulnerable to security breaches and compromised security systems, which could adversely affect our reputation.
 
30

Table of Contents
We rely on the collection and use of personally identifiable information from clients to conduct our business. We disclose our information collection and dissemination practices in a published privacy statement on our websites, which we may modify from time to time. We may be subject to legal claims, government action, including under the Racketeer Influenced and Corrupt Organizations Act, and damage to our reputation if we act or are perceived to be acting inconsistently with the terms of our privacy statement, client expectations or the law. In the event we or the vendors with which we contract to provide services on behalf of our clients were to suffer a breach of personally identifiable information, our customers could terminate their business with us. Further, we may be subject to claims to the extent individual employees or investment sales and financing professionals breach or fail to adhere to company policies and practices and such actions jeopardize any personally identifiable information. In addition, concern among potential buyers or sellers about our privacy practices could keep them from using our services or require us to incur significant expense to alter our business practices or educate them about how we use personally identifiable information.
Investment Risks
Our investments in marketable debt securities,
available-for-sale
are subject to certain risks which could affect our overall financial condition, results of operations or cash flows.
We invest a portion of our available cash and cash equivalent balances in money market funds, some of which have floating net asset values or by purchasing marketable debt securities with maturities in excess of three months in a managed portfolio in a variety of fixed or variable rate debt securities, including U.S. government and federal agency securities and corporate debt securities. The primary objective of our investment activity is to maintain the safety of principal, provide for future liquidity requirements while maximizing yields without significantly increasing risk. Should any of our investments or marketable debt securities lose value or have their liquidity impaired, it could affect our overall financial condition. Additionally, should we choose or are required to sell these securities in the future at a loss, our consolidated operating results or cash flows may be affected.
We may be deemed to be an investment company due to our investments in marketable debt securities,
available-for-sale
and, if such a determination were made, we would become subject to significant regulation that would adversely affect our business.
We may be deemed to be an investment company under the Investment Company Act of 1940 if, among other things, we own “investment securities” with a value exceeding 40% of the value of our total assets, unless we qualify under a particular exemption or safe harbor. We invest part of our available cash and cash equivalents in variety of short-term, investment grade securities, some of which may qualify as “investment securities” under the Investment Company Act. Investment companies are subject to registration under the Investment Company Act and compliance with a variety of restrictions and requirements. If we were to be deemed an investment company we would become subject to these restrictions and requirements, and the consequences of having been an investment company without registering under the Investment Company Act could have a material adverse effect on our business, financial condition and results of operations, as well as restrict our ability to sell and issue securities, borrow funds, engage in various transactions or other activities and make certain investment decisions. In addition, we may incur significant costs or limitation on business opportunities to avoid investment company status if an exemption from the Investment Company Act were to be considered unavailable to us at a time when the value of our “investment securities” exceeds 40% of the value of our total assets. We believe that we satisfy the conditions to be exempt from the Investment Company Act because, among other things, we are engaged directly and primarily in a business other than that of investing, reinvesting, owning, holding or trading in securities. However, absent an exemptive order from the SEC, our status of being exempt cannot be assured.
 
31

Table of Contents
Risks Related to Our Founder
Our Chair and founder owns a significant portion of our common stock, which may prevent other stockholders from influencing significant decisions, and the sale of such stock may depress the price of our common stock and impair our ability to raise capital.
George M. Marcus, our Chair and founder beneficially owns approximately 15.1 million shares, or approximately 38% of our outstanding common stock as of December 31, 2021. Because of Mr. Marcus’s substantial ownership of our outstanding common stock, he may be able to significantly influence the outcome of corporate actions requiring stockholder approval, including the election and removal of directors, so long as he controls a significant portion of our common stock. Mr. Marcus’ shares may also be sold in a public or private sale which could adversely affect the prevailing market price of our common stock and could impair our ability to raise capital through the future sales of equity securities.
Our Chair may have actual or potential conflicts of interest because of his position with MMC.
George M. Marcus serves as the Chair of our board of directors and is Chair of the board of directors of MMC. In addition, Mr. Marcus beneficially owns substantially all of the outstanding stock of MMC. His position at MMC and the ownership of any MMC equity or equity awards creates or may create the appearance of conflicts of interest if and when he is faced with decisions that could have different implications for MMC and for us.
General Risks
Our existing goodwill and other intangible assets could become impaired, which may require us to take
non-cash
charges.
Under current accounting guidelines, we evaluate our goodwill and other intangible assets for potential impairment annually or more frequently if circumstances indicate impairment may have occurred. We perform the required annual goodwill impairment evaluation in the fourth quarter of each year. Any impairment of goodwill or other intangible assets would result in a
non-cash
charge against earnings, and such charge could materially adversely affect our reported results of operations and the market price of our common stock in future periods.
In preparing our financial statements we make certain assumptions, judgments and estimates that affect amounts reported in our consolidated financial statements, which, if not accurate, may significantly impact our financial results.
We make assumptions, judgments and estimates that affect amounts reported in our consolidated financial statements. These assumptions, judgments and estimates are drawn from historical experience and various other factors that we believe are reasonable under the circumstances as of the date of the consolidated financial statements. Actual results could differ materially from our estimates, and such differences could significantly impact our financial results.
Changes in United States Generally Accepted Accounting Principles (“U.S. GAAP”) could adversely affect our financial results and may require significant changes to our internal accounting systems and processes.
We prepare our consolidated financial statements in conformity with U.S. GAAP. These principles are subject to interpretation by the Financial Accounting Standards Board (“FASB”), the SEC and various bodies formed to interpret and create appropriate accounting principles and guidance. The FASB periodically issues new accounting standards on a variety of topics. For information regarding new accounting standards, please refer to Note 2 – “Accounting Policies and Recent Accounting Pronouncements” of our Notes to Consolidated Financial Statements. These and other such standards generally result in different accounting principles, which may significantly impact our reported results or could result in variability of our financial results.
 
32

Table of Contents
We are obligated to develop and maintain proper and effective internal control over financial reporting. If we fail to maintain an effective system of internal controls, we may not be able to accurately report financial results or prevent fraud.
Effective internal controls are necessary to provide reliable financial reports and to assist in the effective prevention of fraud. Any inability to provide reliable financial reports or prevent fraud could harm our business.
We must annually evaluate our internal control procedures to satisfy the requirements of Section 404 of the Sarbanes-Oxley Act of 2002, which requires our management and auditors to assess the effectiveness of internal controls. If we fail to remedy or maintain the adequacy of our internal controls when such standards are modified, supplemented or amended from time to time, we could be subject to regulatory scrutiny, civil or criminal penalties or shareholder litigation.
In addition, failure to maintain adequate internal controls could result in financial statements that do not accurately reflect our financial condition. There can be no assurance that we will be able to continue to complete the work necessary to fully comply with the requirements of the Sarbanes-Oxley Act or that our management and external auditors will continue to conclude that our internal controls are effective.
The price of our common stock may fluctuate significantly, and you could lose all or part of your investment.
Volatility in the market price of our common stock may prevent shareholders from being able to sell shares of our common stock at or above the price shareholders paid for them. The market price for our common stock could fluctuate significantly for various reasons, including quarterly and annual variations in our results and those of our competitors; changes to the competitive landscape; estimates and projections by the investment community; the arrival or departure of key personnel, especially the retirement or departure of key senior investment sales and financing professionals and management; the introduction of new services by us or our competitors; acquisitions, strategic alliances or joint ventures involving us or our competitors; and general global and domestic economic, credit and liquidity issues, market or political conditions.
As a result of these factors, investors in our common stock may not be able to resell their shares at or above the price paid to acquire the stock or may not be able to resell them at all. These broad market and industry factors may materially reduce the market price of our common stock, regardless of our operating performance. In addition, price volatility may be greater if the public float and trading volume of our common stock is low.
If securities analysts do not publish research or reports about our business or if they downgrade our Company or our sector, or we do not meet expectations of the analysts the price of our common stock could decline.
The trading market for our common stock depends in part on the research and reports that industry or financial analysts publish about us or our business. These research reports about our business may contain information about us, including, but not limited to estimates of our future results of operations and stock price. We do not control these analysts, nor can we assure that any analysts will continue to follow us, issue research reports or publish information that accurately predicts our actual results or stock price. Furthermore, if we do not meet the expectations of industry or financial analysts or one or more of the analysts who do cover us downgrades our Company or our industry, or the stock of any of our competitors, the price of our common stock could decline. If one or more of these analysts ceases coverage of our Company, we could lose visibility in the market, which in turn could cause the price of our common stock to decline.
Significant fluctuations in our revenues and net income may make it difficult for us to achieve steady earnings growth on a quarterly or an annual basis, which may make the comparison between periods difficult and may cause the price of our common stock to decline.
We have experienced and may continue to experience fluctuations in revenues and net income as a result of many factors, including, but not limited to, economic conditions, capital market disruptions, the timing of
 
33

Table of Contents
transactions, revenue mix and the timing of additional selling, general and administrative expenses to support growth initiatives. We provide many of our services pursuant to contracts that typically expire within six months and that are dependent on the client’s cooperation. Consequently, many of our clients can terminate or significantly reduce their relationships with us on very short notice for any reason.
We plan our capital and operating expenditures based on our expectations of future revenues and, if revenues are below expectations in any given quarter or year, we may be unable to adjust capital or operating expenditures in a timely manner to compensate for any unexpected revenue shortfall, which could have an immediate material adverse effect on our business, financial condition and results of operation.
Future sales or the perception of future sales of a substantial amount of our common stock may depress the price of shares of our common stock.
Future sales, issuances of shares under our Amended and Restated 2013 Omnibus Equity Incentive Plan and 2013 Employee Stock Purchase Plan or the availability of a substantial amount of our common stock in the public market could adversely affect the prevailing market price of our common stock and could impair our ability to raise capital through the future sales of equity securities.
We may issue shares of our common stock or other securities from time to time as consideration for future acquisitions and investments. If any such acquisition or investment is significant, the number of shares of our common stock, or the number or aggregate principal amount, as the case may be, of other securities that we may issue may in turn be substantial. We may also grant registration rights covering those shares of our common stock or other securities in connection with any such acquisitions and investments.
We cannot predict the size of future issuances or sales of our common stock or the effect, if any, that future issuances and sales of our common stock will have on the market price of our common stock. Sales of substantial amounts of our common stock (including shares of our common stock issued in connection with an acquisition), or the perception that such sales could occur, may adversely affect prevailing market prices for our common stock.
Item 1B. Unresolved Staff Comments
Not applicable.
Item 2. Properties
Our principal executive offices are located at 23975 Park Sorrento, Suite 400, Calabasas, California 91302 where our telephone number is (818)
212-2250.
We lease all of our brokerage offices (typically less than 12,000 square feet) and other support facilities in United States and Canada. We believe that our current facilities are adequate to meet our needs through the end of 2022; however, as we continue to expand in various midmarket locations and grow our market share in existing metropolitan areas, we may need to lease additional space.
Item 3. Legal Proceedings
We are involved in claims and legal actions arising in the ordinary course of our business, some of which involve claims for damages that are substantial in amount. Most of these litigation matters are covered by our insurance policies, which contain deductibles, exclusions, claim limits and aggregate policy limits. Such litigation and other proceedings may include, but are not limited to, actions relating to commercial relationships, standard brokerage disputes like the alleged failure to disclose physical or environmental defects or property expenses or contracts, the alleged inadequate disclosure of matters relating to the transaction like the relationships among the parties to the transaction, potential claims or losses pertaining to the asset, vicarious liability based upon conduct of individuals or entities outside of our control, general fraud claims, conflicts of
 
34

Table of Contents
interest claims, employment law claims, including claims challenging the classification of our sales professionals as independent contractors, claims alleging violations of state consumer fraud statutes and intellectual property. While the ultimate liability for these legal proceeding cannot be determined, we review the need for an accrual for loss contingencies quarterly and record an accrual for litigation related losses where the likelihood of loss is both probable and estimable. We do not believe, based on information currently available to us, that the final outcome of these proceedings will have a material adverse effect on our consolidated financial position, results of operations or cash flows.
For information on our legal proceedings, see Note 15 – “Commitments and Contingencies” of our accompanying Notes to Consolidated Financial Statements included in Part II, Item 8 – “Financial Statements and Supplementary Data” of this Annual Report on Form
10-K.
Item 4. Mine Safety Disclosures
Not applicable.
 
35

Table of Contents
PART II
Item 5. Market for Registrant’s Common Equity, Related Stockholder Matters and Issuer Purchases of Equity Securities
Market Information
Our common stock trades on the New York Stock Exchange (“NYSE”) under the symbol “MMI”.
As of February 15, 2022, there were 15 stockholders of record, and the closing price of our common stock was $47.44 per share as reported on the NYSE.
Dividends
On February 16, 2022, the Board of Directors declared a semi-annual regular dividend of $0.25 per share and a special dividend of $1.00 per share, payable on April 4, 2022, to stockholders of record at the close of business on March 8, 2022. Based on the estimated number of shares to be outstanding as of March 8, 2022, the dividends declared aggregated $52.1 million, including dividend equivalents totaling $2.5 million to be paid on unvested restricted stock and deferred stock units granted under the Amended and Restated 2013 Omnibus Equity Incentive Plan. These dividend equivalents will be paid when the underlying restricted stock and deferred stock units vest. Any and all future dividends are subject to review and approval by the Board of Directors.
Stock Performance Graph
The performance graph shall not be deemed “filed” for purposes of Section 18 of the Exchange Act, or otherwise subject to the liabilities under that Section and shall not be deemed to be incorporated by reference into any filing of Marcus & Millichap, Inc. under the Securities Act of 1933, as amended (the “Securities Act”), or the Exchange Act.
The following graph shows a comparison from December 31, 2016 through December 31, 2021 of the cumulative total return for our common stock, the Standard & Poor’s 500 Stock Index (“S&P 500 Index”) and an industry peer group for this period.
The graph assumes that $100 was invested at the market close on December 31, 2016 in the common stock of Marcus & Millichap Inc., the S&P 500 Index and the peer group, and assumes reinvestments of dividends. The stock price performance of the following graph is not necessarily indicative of future stock price performance. The industry peer group is comprised of the following publicly-traded real estate services companies: CBRE Group, Inc., Colliers International Group, Inc., Cushman & Wakefield plc (from August 2018 when it began trading), JLL and Newmark Group, Inc. (from December 2017 when it began trading) (collectively “Peer Group”). We selected our Peer Group based on companies that represent our primary competitors with certain business lines reasonably comparable to ours and based on how long they have been publicly-traded.
 
36

Table of Contents


Base Period

12/31/16
    
12/31/17
    
12/31/18
    
12/31/19
    
12/31/20
    
12/31/21
 
Marcus & Millichap, Inc.
     100.00        122.04        128.48        139.41        139.33        192.59  
S&P 500 Index
     100.00        121.83        116.49        153.17        181.35        233.41  
Peer Group
     100.00        138.72        120.19        177.84        165.11        289.15  
Recent Sales of Unregistered Securities
None.
Purchases of Equity Securities
None.
Item 6. [RESERVED]
Not applicable.
 
37

Table of Contents
Item 7. Management’s Discussion and Analysis of Financial Condition and Results of Operations
The following discussion of our financial condition and results of operations should be read in conjunction with our audited consolidated financial statements and the accompanying notes thereto included elsewhere herein. The following discussion contains, in addition to historical information, forward-looking statements that include risks and uncertainties. Our actual results may differ materially from those anticipated in these forward-looking statements as a result of certain factors, including those factors set forth under Item 1A – “Risk Factors” and Item 7 – “Management’s Discussion and Analysis of Financial Condition and Results of Operations – Overview –
Factors Affecting Our Business
” of this Annual Report on
Form 10-K.
Overview
Our Business
We are a leading national brokerage firm specializing in commercial real estate investment sales, financing, research and advisory services. We have been the top commercial real estate investment broker in the United States based on the number of investment transactions for more than 15 years. As of December 31, 2021, we had 1,994 investment sales and financing professionals that are primarily exclusive independent contractors operating in 82 offices, who provide real estate brokerage and financing services to sellers and buyers of commercial real estate. We also offer market research, consulting and advisory services to our clients. During the year ended December 31, 2021, we closed 13,255 investment sales, financing and other transactions with total sales volume of approximately $84.4 billion. During the year ended December 31, 2020, we closed 8,954 sales, financing and other transactions with total sales volume of approximately $43.4 billion.
We generate revenues by collecting real estate brokerage commissions upon the sale, and fees upon the financing of commercial properties and by providing consulting, advisory and other real estate services. Real estate brokerage commissions are typically based upon the value of the property, and financing fees are typically based upon the size of the loan. During the year ended December 31, 2021, approximately 90% of our revenues were generated from real estate brokerage commissions, 9% from financing fees and 1% from other real estate related services.
Acquisitions
We continue to pursue opportunities to increase our market presence through the execution of our growth strategies by targeting markets based on population, employment, level of commercial real estate sales, inventory and competitive opportunities where we believe the markets will benefit from our commercial real estate investment sales, financing, research and advisory services.
COVID-19
We are closely monitoring the continuing impact of the
COVID-19
pandemic on all aspects of our business and in the regions we operate. We continue to follow the local guidelines in cities where our offices are located, and all of our offices have remained open and accessible to our sales force within health protocols. All support functions to facilitate generating, processing, and closing business have continued through remote access and/or a hybrid work model.
Our business was impacted by the
COVID-19
pandemic during most of 2020, with the total number of transactions and total revenues declining 7.9% and 11.1%, respectively, in the year ended December 31, 2020 compared to the same period in 2019. During the year ended December 31, 2021, total number of transactions and total revenues increased 48.0% and 80.8%, respectively compared to the same period in 2020. While our total revenues were significantly above prior years’ levels, some uncertainty exists in our ability to sustain the growth rates experienced during the year ended December 31, 2021, which was positively impacted by the closing of deals that had been delayed or cancelled and investors’ heightened motivation to transact ahead of potential changes to the tax code and rising interest rates.
 
38

Table of Contents
Due to the continuing uncertainty around the
COVID-19
pandemic, we are unable to predict its potential impact on our future financial condition, results of operations and cash flows. These uncertainties include the scope, severity and duration of the pandemic; variants in the virus, vaccination rates, vaccine mandates and the effects thereof; expectation gaps among buyers and sellers on pricing and property operation, vulnerability to economic weakness and/or slow-down in the recovery; the direct and indirect economic effects of the actions taken by state and local governments to continue to contain the pandemic or mitigate its impact; and the impact of these and other factors on our employees, independent contractors, clients and potential clients.
Factors Affecting Our Business
Our business and our operating results, financial condition and liquidity are significantly affected by the number and size of commercial real estate investment sales and financing transactions that we close in any period. The number and size of these transactions are affected by our ability to recruit and retain investment sales and financing professionals, identify and contract properties for sale and identify those that need financing and refinancing. We principally monitor the commercial real estate market through four factors, which generally drive our business. The factors are the economy, commercial real estate supply and demand, capital markets and investor sentiment and investment activity.
The Economy
Our business is dependent on economic conditions within the markets in which we operate. Changes in the economy on a global, national, regional or local basis can have a positive or a negative impact on our business. Economic indicators and projections related to job growth, unemployment, interest rates, retail spending and confidence trends can have a positive or a negative impact on our business. Overall market conditions, including global trade, interest rate changes and job creation, can affect investor sentiment and, ultimately, the demand for our services from investors in real estate.
The U.S. economy expanded at a strong pace in the fourth quarter resulting in 5.7% GDP growth in 2021, the strongest full-year gain since 1984. That growth was supported by the addition of nearly 6.5 million jobs last year, the most jobs the U.S. has ever added in a single year. Thus far, 84% of the 22.4 million jobs lost during the pandemic have been recovered, and the country appears to be heading toward backfilling the employment lost during the pandemic by the end of 2022. However,
COVID-19
variants, such as Omicron together with the significant labor shortage will likely affect employment additions this year and potentially place additional upward pressure on wages. Wage pressure will join rising housing costs, supply chain bottlenecks and shortages of raw materials, manufacturing inputs, building materials and products to drive inflationary pressure. Headline inflation has surpassed 7%, its highest level since 1982, and the Federal Reserve has signaled that it plans to combat inflation through monetary policy including the wind-down of quantitative easing and by raising the Federal Funds rate. While we believe commercial real estate investment is comparatively inflation resistant, the upward pressure on interest rates has the potential to affect investor activity. Much will depend on the magnitude of the interest rate rise relative to the still elevated level of capital liquidity targeting commercial real estate. The commercial real estate sector delivered a record volume of sales in the fourth quarter as investment capital flowed to these assets. Momentum remains positive entering 2022, but a higher than expected change in interest rates or eruption of geopolitical concerns into crisis could significantly impact the investor enthusiasm.
Commercial Real Estate Supply and Demand
Our business is dependent on the willingness of investors to invest in or sell commercial real estate, which is affected by many factors beyond our control. These factors include the supply of commercial real estate coupled with user demand for these properties and the performance of real estate assets when compared with other investment alternatives, such as stocks and bonds.
Space demand for most commercial property types gained momentum in 2021. At
year-end,
apartment and industrial vacancy rates were at
record-low
levels. Retail demand was positive in each quarter of the year and
 
39

Table of Contents
office properties, still restrained by work-from-home protocols, delivered above average absorption through the second half of the year. Hotel properties,
hard-hit
in the early stages of the pandemic, have nearly returned to
pre-pandemic
occupancy levels while the average daily rate in December stood nearly 7% above the same month in 2019. At the same time, materials shortages and elevated building costs have restrained construction levels for all property types except apartments and industrial space, the two property types that could possibly see record deliveries in 2022. The mitigated supply risk for most property types is a positive factor supporting the commercial real estate outlook. Demand drivers continue to favor suburban areas and metros across the southeast and southwest that are benefiting from elevated
in-migration.
Although vacancy rates in major urban gateway markets like New York and San Francisco were disproportionately impacted by the health crisis, they generated positive commercial real estate space demand through the second half of 2021, supporting the belief that core urban areas could sustain a gradual recovery. The positive momentum of commercial real estate fundamentals has attracted increased capital to the sector, creating a particularly active bid climate for many marketed assets, especially those in markets demonstrating favorable growth metrics. The rising demand for assets has supported increased transaction flow and has placed upward pressure on prices at a macro level.
Capital Markets
Credit and liquidity issues in the financial markets have a direct impact on the flow of capital to the commercial real estate market. Real estate purchases are often financed with debt and, as a result, credit and liquidity impact transaction activity and prices. Changes in interest rates, as well as steady and protracted movements of interest rates in one direction, whether increases or decreases, could adversely or positively affect the operations and income potential of commercial real estate properties, as well as lender and equity underwriting for real estate investments. These changes generally influence the demand of investors for commercial real estate investments.
Both equity and debt capital remain very liquid, with financing broadly available for most property types in most markets. Lending institutions continue to compete to place capital, keeping borrowing rates low, but the recently accelerated taper of quantitative easing together with more hawkish messaging from the Federal Reserve have placed upward pressure on interest rates. With inflation at a
40-year
high, we believe the Federal Reserve will remain committed to raising both short- and long-term interest rates. If rates rise nominally this year, we believe investors will stay aggressive in their bidding for assets, but if the Federal Reserve boosts rates significantly it could force investors to recalibrate their underwriting. That could potentially widen the expectation gap between buyers and sellers in 2022. The volume of capital competing for commercial real estate assets has been substantial as demonstrated by the record fourth quarter 2021 sales activity. Barring a major interest rate increase or another severe
COVID-19
outbreak, we believe the pool of capital seeking placement in commercial real estate could sustain strong transaction activity well into 2022.
Investor Sentiment and Investment Activity
We rely on investors to buy and sell properties in order to generate commissions. Investors’ desires to engage in real estate transactions are dependent on many factors that are beyond our control. The economy, supply and demand for properly positioned properties, available credit and market events impact investor sentiment and, therefore, transaction velocity. In addition, our private clients, who make up the largest source of revenue, are often motivated to buy, sell and/or refinance properties due to personal circumstances such as death, divorce, partnership breakups and estate planning.
Dollar volumes for commercial real estate investments reached record levels in 2021, outpacing the previous record set in 2019 by approximately 35%. The market activity reflects the elevated market liquidity, still low interest rates, strong commercial real estate performance trends in most property types, positive economic and demographic drivers and the perception in the market that commercial real estate has greater inflation resistance than most other investment classes. The demand for commercial real estate is especially acute in markets with strong growth trends. Buyers have aggressively competed for assets, driving record pricing for
 
40

Table of Contents
some property types in select markets. Most property types have either fully recovered from the pandemic recession or are demonstrating positive recovery characteristics. Apartments and necessity retail including single-tenant, and industrial properties (e.g. fast food restaurants and drug stores), have performed well throughout the pandemic and therefore remain most favored by investors. Apartments and retail make up the majority of MMI’s revenue, and industrial is one of the fastest growing segments for the Company. The office property type faces the greatest uncertainty due to questions about corporate strategies for returning to the offices, particularly following the recent Omicron wave. Office pricing has become increasingly stable, but
investors still favor suburban assets with long-term leases in place. Senior housing has also faced headwinds due to the disproportionate
COVID-19
health risks faced by the elderly. Despite the uncertainty surrounding these two property segments, we believe the overall enthusiasm for commercial real estate investment as demonstrated by increasing transaction activity remains positive.
Seasonality
Our real estate brokerage commissions and financing fees have tended to be seasonal and, combined with other factors, can affect an investor’s ability to compare our financial condition and results of operations on a
quarter-by-quarter
basis. Historically, this seasonality has generally caused our revenue, operating income, net income and cash flows from operating activities to be lower in the first half of the year and higher in the second half of the year, particularly in the fourth quarter. The concentration of earnings and cash flows in the last six months of the year, particularly in the fourth quarter, is due to an industry-wide focus of clients to complete transactions towards the end of the calendar year. This historical trend can be disrupted both positively and negatively by major economic events, political events, natural disasters or pandemics such as the
COVID-19
pandemic, which may impact, among other things, investor sentiment for a particular property type or location, volatility in financial markets, current and future projections of interest rates, attractiveness of other asset classes, market liquidity and the extent of limitations or availability of capital allocations for larger property buyers, among others. Private client investors may accelerate or delay transactions due to personal or business-related reasons unrelated to economic events. In addition, our operating margins are typically lower during the second half of each year due to our commission structure for some of our senior investment sales and financing professionals. These senior investment sales and financing professionals are on a graduated commission schedule that resets annually, pursuant to which higher commissions are paid for higher sales volumes. Our historical pattern of seasonality may or may not continue to the same degree experienced in prior years.
Operating Segments
We follow the guidance for segment reporting, which requires reporting information on operating segments in interim and annual financial statements. Substantially all of our operations involve the delivery of commercial real estate services to our customers including real estate investment sales, financing and consulting and advisory services. Management makes operating decisions, assesses performance and allocates resources based on an ongoing review of these integrated operations, which constitute only one operating segment for financial reporting purposes.
Key Financial Measures and Indicators
Revenues
Our revenues are primarily generated from our real estate investment sales business. In addition to real estate brokerage commissions, we generate revenues from financing fees and from other revenues, which are primarily comprised of consulting and advisory fees.
Because our business is transaction oriented, we rely on investment sales and financing professionals to continually develop leads, identify properties to sell and finance, market those properties and close the sale timely to generate a consistent flow of revenue. While our sales volume is impacted by seasonality factors, the timing of closings is also dependent on many market and personal factors unique to a particular client or
 
41

Table of Contents
transaction, particularly clients transacting in the
$1-$10 million
private client market segment. These factors can cause transactions to be accelerated or delayed beyond our control. Further, commission rates earned are generally inversely related to the value of the property sold. As a result of our expansion into the middle and larger transaction market segments, we have seen our overall commission rates fluctuate from
period-to-period
as a result of changes in the relative mix of the number and volume of investment sales transactions closed in the middle and larger transaction market segments as compared to the
$1-$10 million
private client market segment. These factors may result in
period-to-period
variations in our revenues that differ from historical patterns.
A small percentage of our transactions include retainer fees and/or breakage fees. Retainer fees are credited against a success-based fee paid upon the closing of a transaction or a breakage fee. Transactions that are terminated before completion will sometimes generate breakage fees, which are usually calculated as a set amount or a percentage of the fee we would have received had the transaction closed.
Real Estate Brokerage Commissions
We earn real estate brokerage commissions by acting as a broker for commercial real estate owners seeking to sell or investors seeking to buy properties. Revenues from real estate brokerage commissions are typically recognized at the close of escrow.
Financing Fees
We earn financing fees by securing financing on purchase transactions or by securing refinancing of our clients’ existing mortgage debt. We recognize financing fee revenues at the time the loan closes, and we have no remaining significant obligations for performance in connection with the transaction.
To a lesser extent, we also earn mortgage servicing revenue, mortgage servicing fees, equity advisory services, loan sales and ancillary fees associated with financing activities. We recognize mortgage servicing revenues upon the acquisition of a servicing obligation. We generate mortgage servicing fees through the provision of collection, remittance, recordkeeping, reporting and other related mortgage servicing functions, activities and services.
Other Revenues
Other revenues include fees generated from consulting, advisory and other real estate services performed by our investment sales professionals, as well as referral fees from other real estate brokers. Revenues from these services are recognized as they are performed and completed.
Operating Expenses
Our operating expenses consist of cost of services, selling, general and administrative expenses and depreciation and amortization. The significant components of our expenses are further described below.
Cost of Services
The majority of our cost of services expense is variable commissions paid to our investment sales professionals and compensation-related costs related to our financing activities. Commission expenses are directly attributable to providing services to our clients for investment sales and financing services. Most of our investment sales and financing professionals are independent contractors and are paid commissions; however, because there are some who are initially paid a salary and certain of our financing professionals are employees, costs of services also include employee-related compensation, employer taxes and benefits for those employees. The commission rates we pay to our investment sales and financing professionals vary based on individual contracts negotiated and are generally higher for the more experienced professionals. Some of our most senior
 
42

Table of Contents
investment sales and financing professionals also have the ability to earn additional commissions after meeting certain annual financial thresholds. These additional commissions are recognized as cost of services in the period in which they are earned. Payment of a portion of these additional commissions are generally deferred for a period of one to three years, at our election, and paid at the beginning of the second and fourth calendar year. Cost of services also includes referral fees paid to other real estate brokers where we are the principal service provider. Cost of services, therefore, can vary based on the commission structure of the independent contractors that closed transactions in any particular period.
Selling, General and Administrative Expenses
The largest expense component within selling, general and administrative expenses is personnel expenses for our management team and sales and support staff. In addition, these costs include facilities costs (excluding depreciation and amortization), staff related expenses, sales, marketing, legal, telecommunication, network, data sources, transaction costs related to acquisitions, changes in fair value for contingent and deferred consideration and other administrative expenses. Also included in selling, general and administrative are expenses for stock-based compensation to
non-employee
directors, employees and independent contractors (i.e. investment sales and financing professionals) under the Amended and Restated 2013 Omnibus Equity Incentive Plan (“2013 Plan”) and the 2013 Employee Stock Purchase Plan (“ESPP”).
Depreciation and Amortization Expense
Depreciation expense consists of depreciation recorded on our computer software and hardware and furniture, fixture and equipment. Depreciation is provided over estimated useful lives ranging from three to seven years for assets. Amortization expense consists of (i) amortization recorded on our mortgage servicing rights (“MSRs”) using the interest method over the period that servicing income is expected to be received and (ii) amortization recorded on intangible assets amortized on a straight-line basis using a useful life between one and seven years.
Other Income (Expense), Net
Other income (expense), net primarily consists of interest income, net gains or losses on our deferred compensation plan assets, realized gains and losses on our marketable debt securities,
available-for-sale,
foreign currency gains and losses and other
non-operating
income and expenses.
Interest Expense
Interest expense primarily consists of interest expense associated with the stock appreciation rights (“SARs”) liability, notes payable to former stockholders (through the second quarter of 2020 when fully repaid) and our credit agreement.
Provision for Income Taxes
We are subject to U.S. and Canadian federal taxes and individual state and local taxes based on the income generated in the jurisdictions in which we operate. Our effective tax rate fluctuates as a result of the change in the mix of our activities in the jurisdictions we operate due to differing tax rates in those jurisdictions and the impact of permanent items, including principally compensation charges, qualified transportation fringe benefits, uncertain tax positions, meals and entertainment and
tax-exempt
deferred compensation plan assets. Our provision for income taxes includes the windfall tax benefits and shortfall expenses, net, from shares issued in connection with our 2013 Plan and ESPP.
We record deferred taxes, net based on the tax rate expected to be in effect at the time those items are expected to be recognized for tax purposes.
 
43

Table of Contents
Results of Operations
Following is a discussion of our results of operations for the years ended December 31, 2021 and 2020. The tables included in the period comparisons below provide summaries of our results of operations. The
period-to-period
comparisons of financial results are not necessarily indicative of future results.
Key Operating Metrics
We regularly review a number of key metrics to evaluate our business, measure our performance, identify trends affecting our business, formulate financial projections and make strategic decisions. We also believe these metrics are relevant to investors’ and others’ assessment of our financial condition and results of operations. During the years ended December 31, 2021, 2020 and 2019, we closed more than 13,200, 8,900 and 9,700 investment sales, financing and other transactions, respectively, with total sales volume of approximately $84.4 billion, $43.4 billion and $49.7 billion, respectively. Such key metrics for real estate brokerage and financing activities (excluding other transactions) are as follows:
 
    
Years Ended December 31,
 
    
2021
   
2020
   
2019
 
Real Estate Brokerage:
      
Average Number of Investment Sales Professionals
     1,925       1,920       1,843  
Average Number of Transactions per Investment Sales Professional
     5.01       3.28       3.82  
Average Commission per Transaction
   $ 121,319     $ 100,694     $ 103,572  
Average Commission Rate
     1.73     1.98     1.98
Average Transaction Size (in thousands)
   $ 6,994     $ 5,097     $ 5,234  
Total Number of Transactions
     9,652       6,288       7,042  
Total Sales Volume (in millions)
   $ 67,507     $ 32,052     $ 36,858  
    
Years Ended December 31,
 
    
2021
   
2020
   
2019
 
Financing
(1)
:
      
Average Number of Financing Professionals
     85       86       102  
Average Number of Transactions per Financing Professional
     29.11       22.59       19.06  
Average Fee per Transaction
   $ 37,959     $ 33,747     $ 32,680  
Average Fee Rate
     0.81     0.85     0.88
Average Transaction Size (in thousands)
   $ 4,691     $ 3,948     $ 3,693  
Total Number of Transactions
     2,474       1,943       1,944  
Total Financing Volume (in millions)
   $ 11,605     $ 7,672     $ 7,180  
 
(1)
Operating metrics calculated excluding certain financing fees not directly associated to transactions.
 
44

Table of Contents
Comparison of Years Ended December 31, 2021 and 2020
Below are key operating results for the year ended December 31, 2021 compared to the results for the year ended December 31, 2020 (dollars in thousands):
 
    
Year

Ended

December 31,

2021
   
Percentage

of

Revenue
   
Year

Ended

December 31,

2020
   
Percentage

of

Revenue
   
Change
 
   
Dollar
   
Percentage
 
Revenues:
            
Real estate brokerage commissions
   $ 1,170,969       90.3   $ 633,164       88.3   $ 537,805       84.9
Financing fees
     109,690       8.5       70,538       9.8       39,152       55.5
Other revenues
     15,781       1.2       13,204       1.9       2,577       19.5


Total revenues
     1,296,440       100.0       716,906       100.0       579,534       80.8


Operating expenses:
            
Cost of services
     840,209       64.8       447,879       62.5       392,330       87.6
Selling, general and administrative
     255,154       19.7       204,514       28.5       50,640       24.8
Depreciation and amortization
     11,721       0.9       10,899       1.5       822       7.5


Total operating expenses
     1,107,084       85.4       663,292       92.5       443,792       66.9


Operating income
     189,356       14.6       53,614       7.5       135,742       253.2
Other income (expense), net
     4,527       0.3       6,650       0.9       (2,123     (31.9 )% 
Interest expense
     (580     (0.0     (900     (0.1     320       (35.6 )% 


Income before provision for income taxes
     193,303       14.9       59,364       8.3       133,939       225.6
Provision for income taxes
     50,833       3.9       16,526       2.3       34,307       207.6


Net income
   $ 142,470       11.0   $ 42,838       6.0   $ 99,632       232.6


Adjusted EBITDA
(1)
   $ 213,002       16.4   $ 75,699       10.6   $ 137,303       181.4


(1)
 
Adjusted EBITDA is not a measurement of our financial performance under U.S. generally accepted accounting principles (“U.S. GAAP”) and should not be considered as an alternative to net income, operating income or any other measures derived in accordance with U.S. GAAP. For a definition of Adjusted EBITDA and a reconciliation of Adjusted EBITDA to net income, see
“Non-GAAP
Financial Measure.”
Revenues
Our total revenues were $1.3 billion in 2021 compared to $716.9 million in 2020, an increase of $579.5 million, or 80.8%. Total revenues increased as a result of increases in real estate brokerage commissions, financing fees and other revenues, as described below.
Real estate brokerage commissions.
Revenues from real estate brokerage commissions increased to $1.2 billion in 2021 from $633.2 million in 2020, an increase of $537.8 million, or 84.9%. The increase was driven by a 110.6% increase in sales volume generated by a 53.5% increase in the number of investment sales transactions and a 37.2% increase in the average transaction size. The increases were partially offset by a 25 basis points reduction in the average commission rates due to a larger proportion of transactions closed from the Larger Transaction Market segment.
Financing fees.
Revenues from financing fees increased to $109.7 million in 2021 from $70.5 million in 2020, an increase of $39.2 million, or 55.5%, in part spurred by growth from acquisitions in 2020 and other
 
45

Table of Contents
ancillary financing fees. The increase was driven by a 51.3% increase in financing volume, partially offset by a four basis points reduction in average commission rates due in part to fees from certain larger loan transactions. Financing volume was impacted by a 18.8% increase in the average transaction size and a 27.3% increase in the number of financing transactions.
Other revenues.
Other revenues increased to $15.8 million in 2021 from $13.2 million in 2020, an increase of $2.6 million, or 19.5%. The increase was primarily driven by increases in consulting and advisory services during 2021, compared to 2020.
Operating expenses
Our total operating expenses were $1.1 billion in 2021 compared to $663.3 million in 2020, an increase of $443.8 million, or 66.9%. The increase was primarily due to increases in cost of services, which are variable commissions paid to our investment sales professionals and compensation related costs in connection with our financing activities, selling, general and administrative costs and depreciation and amortization expense, as described below.
Cost of services.
 Cost of services in 2021 increased to $840.2 million from $447.9 million in 2020, an increase of $392.3 million, or 87.6%. The increase was primarily due to increased commission expenses driven by the related increased revenues noted above. Cost of services as a percent of total revenues increased to 64.8% compared to 62.5% for 2020 primarily due to our senior investment sales and financing professionals who earn additional commissions after meeting certain annual financial thresholds, reaching their thresholds earlier than prior years and a higher proportion of transactions closed by our more senior investment sales and financing professionals.
Selling, general and administrative expense.
Selling, general and administrative expense in 2021 increased $50.6 million, or 24.8%, to $255.2 million from $204.5 million in 2020. The increase was primarily due to increases in (i) compensation related costs, primarily driven by increases in management performance compensation due to a significant year-over-year increase in operating results; (ii) facilities expenses due to expansion of existing offices; (iii) business development, marketing and other support related to the long-term retention of our sales and financing professionals; and (iv) net change in value of contingent and deferred consideration in connection with our acquisition activities. These increases were partially offset by decreases in (i) sales operations support and promotional marketing expenses primarily due to the cancellation of the Company’s annual sales recognition event typically held during the first quarter of 2021 due to ongoing concerns about the pandemic; and (ii) legal costs.
Depreciation and amortization expense.
Depreciation and amortization expense increased to $11.7 million in 2021 from $10.9 million in 2020, an increase of $0.8 million, or 7.5%. The increase was primarily driven by capital expenditures due to our growth and investments in technology.
Other income (expense), net
Other income (expense), net decreased to $4.5 million in 2021 from $6.7 million in 2020. The decrease was primarily driven by a $2.6 million decrease in interest income on our investments in marketable debt securities,
available-for-sale
due to replacement of maturing marketable debt securities,
available-for-sale
with debt securities at lower interest rates. This decrease was partially offset by a favorable change in the value of our deferred compensation plan assets that are held in a rabbi trust.
Interest expense
Interest expense decreased to $0.6 million in 2021 from $0.9 million in 2020. The decrease was primarily due to a decrease in interest expense on the SARs liability due to lower interest rates and lower average principal outstanding and no interest expense related to notes payable to former stockholders, which were fully repaid during the second quarter of 2020.
 
46

Table of Contents
Provision for income taxes
The provision for income taxes was $50.8 million for 2021 compared to $16.5 million in 2020, an increase of $34.3 million, or 207.6%. The effective tax rate for 2021 was 26.3%, compared with 27.8% in 2020. The decrease in the effective tax rate was primarily due to an increase in windfall tax benefits, net related to the settlement of stock-based awards and a decrease in Canadian losses which are subject to a full valuation allowance.
Comparison of Years Ended December 31, 2020 and 2019
A discussion regarding our results of operations for the year ended December 31, 2020 compared to the results for the year ended December 31, 2019 can be found under Item 7 – “Management’s Discussion and Analysis of Financial Condition and Results of Operations – Results of Operations” in our Annual Report on Form
10-K
for the fiscal year ended December 31, 2020, filed with the SEC on March 1, 2021, which is available on the SEC’s website at
www.sec.gov.
Non-GAAP
Financial Measure
In this Annual Report on Form
10-K,
we include a
non-GAAP
financial measure, adjusted earnings before interest income/expense, taxes, depreciation and amortization, stock-based compensation and other
non-cash
items, or Adjusted EBITDA. We define Adjusted EBITDA as net income before (i) interest income and other, including net realized gains (losses) on marketable debt securities,
available-for-sale
and cash and cash equivalents, (ii) interest expense, (iii) provision for income taxes, (iv) depreciation and amortization, (v) stock-based compensation, and
(vi) non-cash
MSR activity. We use Adjusted EBITDA in our business operations to evaluate the performance of our business, develop budgets and measure our performance against those budgets, among other things. We also believe that analysts and investors use Adjusted EBITDA as a supplemental measure to evaluate our overall operating performance. However, Adjusted EBITDA has material limitations as a supplemental metric and should not be considered in isolation, or as a substitute for analysis of our results as reported under U.S. GAAP. We find Adjusted EBITDA to be a useful management metric to assist in evaluating performance, because Adjusted EBITDA eliminates items related to capital structure, taxes and
non-cash
items. In light of the foregoing limitations, we do not rely solely on Adjusted EBITDA as a performance measure and also consider our U.S. GAAP results. Adjusted EBITDA is not a measurement of our financial performance under U.S. GAAP and should not be considered as an alternative to net income, operating income or any other measures calculated in accordance with U.S. GAAP. Because Adjusted EBITDA is not calculated in the same manner by all companies, it may not be comparable to other similarly titled measures used by other companies. A reconciliation of the most directly comparable U.S. GAAP financial measure, net income, to Adjusted EBITDA is as follows (in thousands):
 
    
Years Ended December 31,
 
    
2021
   
2020
   
2019
 
Net income
   $ 142,470     $ 42,838     $ 76,930  
Adjustments:
      
Interest income and other
(1)
     (2,496     (5,048     (10,322
Interest expense
     580       900       1,388  
Provision for income taxes
     50,833       16,526       30,582  
Depreciation and amortization
     11,721       10,899       8,017  
Stock-based compensation
     10,361       9,905       9,278  
Non-cash
MSR activity
(2)
     (467     (321     (322


Adjusted EBITDA
(3)
   $ 213,002     $ 75,699     $ 115,551  


(1)
 
Other includes net realized gains (losses) on marketable debt securities,
available-for-sale.
(2)
 
Non-cash
MSR activity includes the assumption of servicing obligations.
 
47

Table of Contents
(3)
 
The increase in Adjusted EBITDA for the year ended December 31, 2021 compared to the same period in 2020 is primarily due to an increase in total revenues and a lower proportion of operating expenses compared to total revenues.
Liquidity and Capital Resources
Our primary sources of liquidity are cash and cash equivalents, cash flows from operations, marketable debt securities,
available-for-sale
and, if necessary, borrowings under our credit agreement. In order to enhance yield to us, we have invested a portion of our cash in money market funds and fixed and variable income debt securities, in accordance with our investment policy approved by the board of directors. Certain of our investments in money market funds may not maintain a stable net asset value and may impose fees on redemptions and/or gating fees. To date, the Company has not experienced any restrictions or gating fees on its ability to redeem funds from money market funds. Although we have historically funded our operations through operating cash flows, there can be no assurance that we can continue to meet our cash requirements entirely through our operations, cash and cash equivalents, proceeds from the sale of marketable debt securities,
available-for-sale
or availability under our credit agreement.
Cash Flows
Our total cash and cash equivalents balance increased by $139.0 million to $382.1 million at December 31, 2021, compared to $243.2 million at December 31, 2020. The following table sets forth our summary cash flows for the years ended December 31, 2021, 2020 and 2019 (in thousands):
 
    
Years Ended December 31,
 
    
2021
   
2020
   
2019
 
Net cash provided by operating activities
   $ 255,903     $ 38,088     $ 25,287  
Net cash used in investing activities
     (108,356     (17,228     (3,422
Net cash used in financing activities
     (5,919     (10,330     (3,878
Effect of currency exchange rate changes on cash and cash equivalents
     (2,640     (48     —    


Net increase in cash and cash equivalents
     138,988       10,482       17,987  
Cash and cash equivalents at beginning of year
     243,152       232,670       214,683  


Cash and cash equivalents at end of year
   $ 382,140     $ 243,152     $ 232,670  


Operating Activities
2021 Compared to 2020
. Cash flows provided by operating activities were $255.9 million in 2021 compared to $38.1 million in 2020. Net cash provided by operating activities is driven by our net income adjusted for
non-cash
items and changes in operating assets and liabilities. The $217.8 million improvement in operating cash flows for 2021 compared to 2020 was primarily due to higher total revenues and a lower proportion of operating expenses compared to total revenues, an increase in deferral of certain discretionary commissions and commission payable, lower bonus payments paid during the first quarter of 2021 compared to the same period in 2020 due to the significant decline in operating results for the year ended December 31, 2020, differences in timing of certain payments and receipts and a reduction in advances to our investment sales and financing professionals.
Investing Activities
2021 Compared to 2020
. Cash flows used in investing activities were $108.4 million in 2021 compared to $17.2 million in 2020. The $91.1 million increase in cash flows used in investing activities for 2021 compared to 2020 was primarily due to a $98.5 million increase in net purchase of marketable debt securities,
available-for-sale,
and a $9.5 million purchase of a
held-to-maturity
security, with no such comparable outflow for 2020. The increased usage in investing cash flows was partially offset by a $16.5 million reduction in cash used in acquisitions of businesses, net of cash received during 2021 compared to 2020.
 
48

Table of Contents
Financing Activities
2021 Compared to 2020
. Cash flows used in financing activities were $5.9 million in 2021 compared to $10.3 million in 2020. The $4.4 million decrease in cash flows used in financing activities for 2021 compared to 2020 was primarily impacted by principal payments on notes payable to former stockholders, which were fully repaid during the second quarter of 2020, partially offset by increases in taxes paid related to net share settlement of stock-based awards and principal payments on contingent and deferred consideration in connection with acquisitions. See Note 11 – “Stock-Based Compensation Plans” of our Notes to Consolidated Financial Statements for additional information.
Liquidity
We believe that our existing balances of cash and cash equivalents, cash flows expected to be generated from our operations, proceeds from the sale of marketable debt securities,
available-for-sale
and borrowings available under the Credit Agreement (defined below) will be sufficient to satisfy our operating requirements for at least the next 12 months. If we need to raise additional capital through public or private debt or equity financings, strategic relationships or other arrangements, this capital might not be available to us in a timely manner, on acceptable terms, or at all. Our failure to raise sufficient capital when needed could prevent us from funding acquisitions or otherwise financing our growth or operations. In addition, our SARs agreements have provisions which could accelerate repayment of outstanding principal and accrued interest and impact our liquidity. As of December 31, 2021, cash and cash equivalents and marketable debt securities,
available-for-sale,
aggregated $678.6 million, and we had $59.5 million of borrowing capacity under our credit agreement.
Credit Agreement
We have a Credit Agreement with Wells Fargo Bank, National Association for a $60.0 million principal amount senior secured revolving credit facility that is guaranteed by all of our domestic subsidiaries and matures on June 1, 2022 (the “Credit Agreement”). See Note 15 – “Commitments and Contingencies” of our Notes to Consolidated Financial Statements for additional information on the Credit Agreement.
Off Balance Sheet Arrangements
The Company, in connection with the strategic alliance with M&T Realty Capital Corporation (“M&T Realty Capital”), has agreed to provide loan opportunities that may be funded through M&T Realty Capital’s DUS Selling and Servicing Agreement with Fannie Mae. M&T Realty Capital’s agreement with Fannie Mae requires M&T Realty Capital to guarantee a portion of each funded loan. On a
loan-by-loan
basis, the Company, at its option, can agree to assume a portion of M&T Realty’s guarantee obligation of loan opportunities presented to and closed by M&T Realty Capital. As of December 31, 2021, the Company has not agreed to any guarantee obligations for loan opportunities presented to M&T Realty Capital.
 
49

Table of Contents
Material Cash Requirements
The following table summarizes current and long-term material cash requirements as of December 31, 2021, which we expect to fund primarily with operating cash flows (in thousands):
 
    
Total
    
Less than
1 Year
    
1-3

Years
    
3-5

Years
    
More
Than 5
Years
    
Other 
(7)
 
Operating lease liabilities, including imputed interest
(1)
   $ 82,740      $ 20,901      $ 32,952      $ 22,149      $ 6,738      $ —    
SARs liability (principal and interest)
(2)
     21,019        2,241        4,752        5,266        8,760        —    
Deferred commissions payable
(3)
     69,256        37,559        31,697        —          —          —    
Deferred compensation liability
(4)
     8,001        1,080        316        259        119        6,227  
Contingent consideration
(5)
     9,312        2,681        2,923        3,473        235        —    
Deferred consideration
(5)
     9,801        5,112        4,290        399        —          —    
Other
(6)
     18,489        10,193        2,089        550        350        5,307  


   $ 218,618      $ 79,767      $ 79,019      $ 32,096      $ 16,202      $ 11,534  


(1)
 
See Note 4 – “Operating Leases” of our Notes to the Consolidated Financial Statements.
(2)
 
Forecasted principal payments are based on each participant’s estimated retirement age and current contractual interest rate of 3.630% as of January 1, 2022 and reflect required payments that resulted from the retirement of certain executives. See Note 7 – “Selected Balance Sheet Data” of our Notes to the Consolidated Financial Statements.
(3)
 
Includes short-term and long-term deferred commissions payable. See Note 7 – “Selected Balance Sheet Data” of our Notes to the Consolidated Financial Statements.
(4)
 
Represents current estimated payouts for participants currently receiving payments based on their elections at the time of deferral. We hold assets in rabbi trust of $11.5 million to settle outstanding amounts when they become due. Amounts assume no increase or decrease in the liability due to future returns or losses.
See Note 7 – “Selected Balance Sheet Data” of our Notes to the Consolidated Financial Statements.
(5)
 
Relates to contingent and deferred consideration in connection with our business acquisitions. See Note 6 – “Acquisitions, Goodwill and Other Intangible Assets” and Note 9 – “Fair Value Measurements” of our Notes to the Consolidated Financial Statements.
(6)
 
Relates to amounts that may be advanced to sales and financing professionals and uncertain tax positions. See Note 12 – “Income Taxes” and Note 15 – “Commitments and Contingencies” of our Notes to the Consolidated Financial Statements.
(7)
 
Amounts in Other represent amounts where payments are dependent on future events, which may occur at any time from less than 1 year to more than 5 years and relates to our deferred compensation liability and uncertain tax positions. Payments for deferred compensation liability are based on the participants’ elections at the time of deferral. The net liability for uncertain tax positions may be payable by us in the future. The ultimate resolution depends on many factors and assumptions; accordingly, we are not able to reasonably estimate the timing of such payments, if any.
Other than operating expenses, cash requirements for 2022 are expected to consist primarily of capital expenditures for the future acquisitions, if any, payment of dividends, and advances to our investment sales and financing professionals.
Inflation
Our commissions and other variable costs related to revenue are primarily affected by real estate market supply and demand, which may be affected by uncertain or changing economic and market conditions, including inflation/deflation arising in connection with and in response to various macroeconomic factors, including the effects of the
COVID-19
pandemic on the broader economy.
 
50

Table of Contents
The Federal Reserve has signaled its plans to combat inflation through monetary policy including the wind-down of quantitative easing and by raising the Federal Funds rate. While commercial real estate investment is comparatively inflation resistant, the upward pressure on interest rates has the potential to affect investor activity. The investor activity will depend on the magnitude of changes in interest rates relative to the elevated level of capital liquidity targeting commercial real estate. The actual economic impact from inflation/deflation to our business remains unknown at this time.
Critical Accounting Policies; Use of Estimates
We prepare our financial statements in accordance with U.S. GAAP. In applying many of these accounting principles, we make assumptions, estimates and/or judgments that affect the reported amounts of assets, liabilities, revenues and expenses in our consolidated financial statements. We base our estimates and judgments on historical experience and other assumptions that we believe are reasonable under the circumstances. These assumptions, estimates and/or judgments, however, are often subjective and our actual results may change based on changing circumstances or changes in our analyses. If actual amounts are ultimately different from our estimates, the revisions are included in our results of operations for the period in which the actual amounts become known.
We believe that the critical accounting policies discussed below involve a greater degree of judgment or complexity than our other accounting policies. Accordingly, these are the policies we believe are the most critical to aid in fully understanding and evaluating our consolidated financial condition and results of operations. See the notes to our consolidated financial statements for a summary of our significant accounting policies.
Income Taxes
We account for income taxes under the asset and liability method. We recognize deferred tax assets and liabilities for the future tax consequences attributable to (i) differences between the financial statement carrying amounts of existing assets and liabilities and their respective tax basis, and (ii) operating losses and tax credit carryforwards. We measure existing deferred tax assets and liabilities using enacted tax rates expected to apply to taxable income in the years in which we expect to have temporary differences realized or settled. We recognize in the provision for income taxes, the effect on deferred tax assets and liabilities of a change in tax rates in the period that includes the enactment date. We periodically evaluate deferred tax assets to assess whether it is likely that the deferred tax assets will be realized. In determining whether a valuation allowance is required, we consider the timing of deferred tax reversals, current year taxable income and historical performance. Valuation allowances are provided against deferred tax assets when it is
more-likely-than-not
that some portion or all of the deferred tax asset will not be realized. Our valuation allowance is related principally to losses incurred in our Canadian operations. Future results of operations of the Canadian business will impact valuation allowances in the future. These factors have caused our effective tax rate to range from 26.3% to 28.4% over the past three years.
Because of the nature of our business, which includes activity in the U.S. and Canada, incorporating numerous states and provinces as well as local jurisdictions, our tax position can be complex. As such, our effective tax rate is subject to changes as a result of fluctuations in the mix of our activity in the various jurisdictions in which we operate including changes in tax rates, state apportionment, tax related interest and penalties, valuation allowances and other permanent items, including net windfalls and shortfalls related to stock-based compensation. Calculating some of the amounts involves a high degree of judgment. Our state taxes, net of federal benefit, has ranged from 4.8% to 5.3% over the past three years.
We evaluate our tax positions quarterly. The threshold for recognizing the benefits of tax return positions in the financial statements is “more likely than not” to be sustained by the taxing authority and requires measurement of a tax position meeting the
more-likely-than-not
criterion, based on the largest benefit that is more than 50% likely to be realized. We assess our inventory of tax positions with respect to all applicable
 
51

Table of Contents
income tax issues for all open tax years (in each respective jurisdiction) and determine whether uncertain tax positions are required to be recognized in our consolidated financial statements.
We recognize interest and penalties incurred as income tax expense. See Note 12 – “Income Taxes” of our Notes to the Consolidated Financial Statements for additional information.
Leases
Our leases consist of purpose
built-out
office space, which reverts to the lessor upon termination of the lease and operating leases for autos. We determine if an arrangement is a lease at inception.
Right-of-use
assets (“ROU assets”) represent our right to use an underlying asset for the lease term and lease liabilities represent our contractual obligation to make lease payments under the lease. Operating leases are included in operating lease ROU assets,
non-current,
and operating lease liabilities current and
non-current
captions in the consolidated balance sheets.
Operating lease ROU assets and liabilities are recognized on the commencement date based on the present value of lease payments over the lease term. Lease agreements may contain periods of free rent or reduced rent, predetermined fixed increases in the minimum rent and renewal or termination options, all of which add complexity and impact the determination of the lease term and lease payments to be used in calculating the lease liability. Certain facility leases provide for rental escalations related to increases in the lessors’ direct operating expenses. We use the implicit rate in the lease when determinable. As most of our leases do not have a determinable implicit rate, determining the rate to be used in our calculations is judgmental. We use an estimated incremental borrowing rate based on borrowing options under our credit agreement and apply a spread over treasury rates for the indicated term of the lease based on the information available on the commencement date of the lease. As a result, the incremental borrowing rate has and will continue to be impacted by market interest rates. The weighted incremental borrowing rate was 2.9% and 3.1% in 2021 and 2020, respectively. Any payments for completed improvements, determined to be owed by the lessor, net of incentives received, are recorded as an increase to the ROU asset and considered in the determination of the lease cost.
We have lease agreements with lease and
non-lease
components, which are accounted for as a single lease component. Lease cost is recognized on a straight-line basis over the lease term. Variable lease payments consist of common area costs, insurance, taxes, utilities, parking and other lease related costs, which are determined principally based on billings from landlords.
Investments in Marketable Debt Securities,
Available-for-Sale
We maintain a portfolio of investments in a variety of fixed and variable rate debt securities, including U.S. treasuries, U.S. government sponsored entities, corporate debt, asset-backed securities and other. We consider our investments in marketable debt securities to be
available-for-sale,
and accordingly, are recorded at their fair values. We determine the appropriate classification of investments in marketable debt securities at the time of purchase. Interest along with amortization of purchase premiums and accretion of discounts from the purchase date through the estimated maturity date, including consideration of variable maturities and contractual call provisions, are included in other income (expense), net in the consolidated statements of net and comprehensive income. See Note 5 – “Investments in Marketable Debt Securities,
Available-for-Sale”
of our Notes to the Consolidated Financial Statements for additional information. We typically invest in highly rated debt securities, and our investment policy generally limits the amount of credit exposure to any one issuer. The policy requires substantially all investments to be investment grade, with the primary objective of minimizing the potential risk of principal loss and matching long-term liabilities.
Unrealized losses on our marketable securities,
available-for-sale,
fluctuate based on changes in market interest rates due the fixed interest rate of most of the securities. Unrealized losses aggregated $511,000 and $50,000 as of December 31, 2021 and 2020, respectively. We review quarterly our investment portfolio for all
 
52

Table of Contents
securities in an unrealized loss position to determine if an impairment charge or credit reserve is required. We exclude accrued interest from both the fair value and the amortized cost basis of marketable debt securities,
available-for-sale,
for the purposes of identifying and measuring an impairment. An investment is impaired if the fair value is less than its amortized cost basis. Impairment relating to credit losses is recorded through a reduction in the amortized cost of the security or an allowance for credit losses and credit loss expense (included in selling, general and administrative expense), limited by the amount that the fair value is less than the amortized cost basis. Impairment that has not been recorded as a credit loss is recorded through other comprehensive income (loss), net of applicable taxes. We made an accounting policy election to not measure an allowance for credit losses for accrued interest receivable. We evaluate
write-off
of accrued interest receivable by the major security-type level at the time credit loss exists for the underlying security.
Determining whether a credit loss exists requires a high degree of judgment, and we consider both qualitative and quantitative factors in making our determination. We evaluate our intent to sell, or whether we will more likely than not be required to sell, the security before recovery of its amortized cost basis. For all securities in an unrealized loss position, we evaluate, among other items, the extent and length of time the fair market value of a security is less than its amortized cost, time to maturity, duration, seniority, the financial condition of the issuer including credit ratings, any changes thereto and relative default rates, leverage ratios, availability of liquidity to make principle and interest payments, performance indicators of the underlying assets, analyst reports and recommendations, and changes in base and market interest rates. If the qualitative and quantitative analysis is sufficient to conclude that an impairment related to credit losses does not exist, we typically do not perform further quantitative analysis to estimate the present value of cash flows expected to be collected from the debt security. Estimates of expected future cash flows are our best estimate based on past events, current conditions and reasonable and supportable economic forecasts. To date, the Company has not recorded any credit losses or impairments on its portfolio of marketable securities, available for sale.
Contingent and Deferred Consideration
In connection with certain business acquisitions, the Company may enter into agreements to pay additional cash or other consideration based on the achievement of certain performance measures and/or service and time requirements. Contingent and deferred consideration in connection with the acquisition of a business is measured at fair value on the acquisition date and remeasured at fair value each reporting period thereafter until the consideration is settled, with changes in fair value recorded in selling, general and administrative expense in the consolidated statements of net and comprehensive income.
In its determination of fair value for contingent and deferred consideration, the Company uses judgment in the determining the probability of achieving contractual EBITDA and other performance targets and the time frame in which the settlements will occur. Further, judgment is used in determining the appropriate current and future interest rates to apply in each situation. The Company estimated the probability of achievement of contractual EBITDA and other performance targets was between 29.0% to 100.0% based on each acquisition’s historical and estimated future performance and risk adjusted discount rates of between 2.2% to 3.5%, which resulted in a recorded fair value for the contingent consideration of $9.3 million and $5.6 million as of December 31, 2021, and 2020, respectively. The Company estimated the fair value of the deferred consideration using a discounted cash flow estimate using market rates, with the only remaining condition on such payments being the passage of time which resulted in a recorded fair value of $9.8 million and $15.3 million as of December 31, 2021, and 2020, respectively. The maximum undiscounted future settlements of contingent and deferred consideration was $28.6 million at December 31, 2021, and the Company is uncertain as to the extent of the volatility in the judgments and unobservable inputs will have on the ultimate settlement of these amounts in the foreseeable future.
Recent Accounting Pronouncements
For information regarding recent accounting pronouncements, see Note 2 – “Accounting Policies and Recent Accounting Pronouncements” of our Notes to the Consolidated Financial Statements set forth in Item 8 of
 
53

Table of Contents
this Annual Report on Form
10-K.
Although we do not believe any of the other accounting pronouncements listed in that note will have a significant impact on our business, we are still in the process of determining the impact of the new pronouncements may have on our consolidated financial statements. 
Item 7A. Quantitative and Qualitative Disclosures About Market Risk
We maintain a portfolio of investments in a variety of fixed and variable debt rate securities, including U.S. Treasuries, U.S. government sponsored entities, corporate debt, asset-backed securities and other. As of December 31, 2021, the fair value of investments in marketable debt securities,
available-for-sale
was $296.5 million. The primary objective of our investment activity is to maintain the safety of principal, and to provide for future liquidity requirements while maximizing yields without significantly increasing risk. While some investments may be securities of companies in foreign countries, all investments are denominated and payable in U.S. Dollars. We do not enter into investments for trading or speculative purposes. While our intent is not to sell these investment securities prior to their stated maturities, we may choose to sell any of the securities for strategic reasons including, but not limited to, anticipated capital requirements, anticipation of credit deterioration, duration management and because a security no longer meets the criteria of our investment policy. We do not use derivatives or similar instruments to manage our interest rate risk. We seek to invest in high quality investments. The weighted average rating (exclusive of cash and cash equivalents) was AA as of December 31, 2021. Maturities are maintained consistent with our short-, medium- and long-term liquidity objectives.
Currently, our portfolio of investments predominantly consists of fixed interest rate debt securities; however, a portion of our investment portfolio may consist of variable interest rate debt securities. Our investments in fixed interest rate debt securities are subject to various market risks. Changes in prevailing interest rates may adversely or positively impact their fair market value should interest rates generally rise or fall. Accordingly, we also may have interest rate risk with variable interest rate debt securities as the income produced may decrease if interest rates fall. Contraction in market liquidity may adversely affect the value of portions of our portfolio and affect our ability to sell securities in the time frames required and at acceptable prices. Uncertainty in future market conditions and interest rates may raise market participant’s expectations of returns, thus impacting the value of securities in our portfolio as well. The following table sets forth the impact on the fair value of our investments as of December 31, 2021 from changes in interest rates based on the weighted average duration of the debt securities in our portfolio (in thousands):
 
Change in Interest Rates
  
Approximate Change in
Fair Value of Investments
Increase (Decrease)
 
2% Decrease
   $ 3,244  
1% Decrease
   $ 2,163  
1% Increase
   $ (3,088
2% Increase
   $ (6,176
Due to the nature of our business and the manner in which we conduct our operations, we believe we do not face any material interest rate risk with respect to other assets and liabilities, equity price risk or other market risks. The functional currency of our Canadian operations is the Canadian dollar. We are exposed to foreign currency exchange rate risk for the settlement of transactions of the Canadian operations as well as unrealized translation adjustments. To date, realized foreign currency exchange rate gains and losses have not been material.
Item 8. Financial Statements and Supplementary Data
See pages beginning at
F-1.
Item 9. Changes in and Disagreements with Accountants on Accounting and Financial Disclosure
None.
 
54

Table of Contents
Item 9A. Controls and Procedures
Evaluation of Disclosure Controls and Procedures
Our management is responsible for establishing and maintaining adequate internal control over financial reporting, as such term is defined in Exchange Act Rules
13a-15(f),
including maintenance of (i) records that in reasonable detail accurately and fairly reflect the transactions and dispositions of our assets, and (ii) policies and procedures that provide reasonable assurance that (a) transactions are recorded as necessary to permit preparation of financial statements in accordance with accounting principles generally accepted in the United States of America, (b) our receipts and expenditures are being made only in accordance with authorizations of management and our board of directors and (c) we will prevent or timely detect unauthorized acquisition, use, or disposition of our assets that could have a material effect on the financial statements.
Our management, with the supervision and participation of our chief executive officer (“CEO”) and chief financial officer (“CFO”), has evaluated the effectiveness of our disclosure controls and procedures (as defined in Rules
13a-
15(e) and
15d-
15(e) under the Exchange Act, as of the end of the period covered by this Annual Report on Form
10-K,
based on the criteria established under the Internal Control Integrated Framework issued by the Committee of Sponsoring Organizations of the Treadway Commission (“COSO”) (2013 framework). Based on such evaluation, our management has concluded that as of December 31, 2021, our disclosure controls and procedures are designed at a reasonable assurance level and are effective to provide reasonable assurance that information we are required to disclose in reports that we file or submit under the Exchange Act is recorded, processed, summarized, and reported within the time periods specified in the rules and forms of the SEC, and that such information is accumulated and communicated to our management, including our CEO and CFO, as appropriate, to allow timely decisions regarding required disclosure.
Management’s Report on Internal Control over Financial Reporting
Our management is responsible for establishing and maintaining adequate internal control over financial reporting, as defined in Rules
13a-15(f)
and
15d-15(f)
under the Exchange Act.
Our system of internal control is designed to provide reasonable assurance regarding the reliability of financial reporting and preparation of our financial statements for external reporting purposes in accordance with United States generally accepted accounting principles. Our management, including our CEO and CFO, assessed the effectiveness of our internal control over financial reporting as of December 31, 2021. In conducting its assessment, management used the criteria issued by COSO. Based on this assessment, management concluded that, as of December 31, 2021, our internal control over financial reporting was effective based on those criteria. The effectiveness of internal control over financial reporting as of December 31, 2021 has been audited by Ernst & Young LLP, an independent registered public accounting firm, as stated in their report which is included herein.
Management, including our CEO and CFO, does not expect that our disclosure controls and procedures, or our internal control over financial reporting will prevent all error and fraud. A control system, no matter how well conceived and operated, can provide only reasonable, not absolute, assurance that the objectives of the control system are met. Further, the design of a control system must reflect the fact that there are resource constraints and the benefit of controls must be considered relative to their costs. Because of the inherent limitations in all control systems, no evaluation of controls can provide absolute assurance that all control issues and instances of fraud, if any, have been detected.
Changes in Internal Control over Financial Reporting
There have not been any changes in our internal control over financial reporting (as such term is defined in Rules
13a-15(f)
and
15d-15(f)
under the Exchange Act) during the quarter ended December 31, 2021 that have materially affected, or are reasonably likely to materially affect, our internal control over financial reporting. We
 
55

Table of Contents
have not experienced any significant impact to our internal controls over financial reporting despite the fact that most of our employees and independent contractors are working remotely due to the
COVID-19
pandemic. The design of our processes and controls allow for remote execution with accessibility to secure data. We are continually monitoring and assessing the
COVID-19
situation to minimize the impact, if any, on the design and operating effectiveness on our internal controls.
Inherent Limitations on Effectiveness of Controls
In designing and evaluating the disclosure controls and procedures, management recognizes that any controls and procedures, no matter how well designed and operated, can provide only reasonable assurance of achieving the desired control objectives. In addition, the design of disclosure controls and procedures must reflect the fact that there are resource constraints and that management is required to apply judgment in evaluating the benefits of possible controls and procedures relative to their costs. Internal control over financial reporting cannot provide absolute assurance of achieving financial reporting objectives because of the inherent limitations of any system of internal control. Internal control over financial reporting is a process that involves human diligence and compliance and is subject to lapses of judgment and breakdowns resulting from human failures. Internal control over financial reporting also can be circumvented by collusion or improper overriding of controls. As a result of such limitations, there is risk that material misstatements may not be prevented or detected on a timely basis by internal control over financial reporting. However, these inherent limitations are known features of the financial reporting process. Therefore, it is possible to design into the process safeguards to reduce, though not eliminate, this risk.
Item 9B. Other Information
None.
Item 9C. Disclosure Regarding Foreign Jurisdictions that Prevent Inspections
None.
 
56

Table of Contents
PART III
Item 10. Directors, Executive Officers and Corporate Governance
Executive Officers
The names and ages of our executive officers and directors as of March 1, 2022 are as follows:
 
Name
  
Age
    
Position(s)
Hessam Nadji
     56      President, Chief Executive Officer and Director
Steven F. DeGennaro
     58      Executive Vice President and Chief Financial Officer
John David Parker
     41      Executive Vice President and Chief Operating Officer, Eastern Division
Richard Matricaria
     43      Executive Vice President and Chief Operating Officer, Western Division
Gregory A. LaBerge
     51      Senior Vice President, Chief Administrative Officer
Hessam Nadji
Mr. Nadji has served as President and Chief Executive Officer and as a director of the Company since March 2016. Mr. Nadji previously served as Senior Executive Vice President and Chief Strategy Officer. He joined the Company as Vice President of Research in 1996 and held various other senior management roles through the years, including Chief Marketing Officer and head of the Company’s specialty brokerage divisions. He played a leading role in the Company’s initial public offering in 2013. Mr. Nadji received a B.S. in information management and computer science from City University in Seattle and has over 30 years of experience working in the real estate industry.
Steven F. DeGennaro
Mr. DeGennaro has served as Executive Vice President and Chief Financial Officer since August 2020. Prior to joining the Company, Mr. DeGennaro held the position of Chief Financial Officer at InTouch Technologies, Inc., a venture-backed telehealth company, from March 2018 to July 2020. Prior to that he served as Chief Financial Officer at Xirrus, Inc., a manufacturer of wireless networking products, from January 2004 to November 2017. Mr. DeGennaro began his career at KPMG. Mr. DeGennaro holds a B.B.A. in Accounting from the University of San Diego.
John David Parker
Mr. Parker has served as Executive Vice President and Chief Operating Officer, Eastern Division since June 2021. Mr. Parker joined the firm in 2004 as a multifamily agent in the Manhattan office and transitioned to management in 2006. In 2007, Mr. Parker opened our Brooklyn office and took over responsibility for the New York regional offices soon afterward. Mr. Parker was appointed Division Manager for the Northeast in 2016 and has been instrumental in driving our expansion in Canada. Mr. Parker holds a bachelor’s degree in operations and information systems management from Pennsylvania State University.
Richard Matricaria
Mr. Matricaria has served as Executive Vice President and Chief Operating Officer, Western Division since June 2021. Mr. Matricaria joined the company in 2000 as a retail broker for several years from 2002 to 2010 before moving to management in 2010. From 2010 to 2016, Mr. Matricaria opened offices in Orlando and Tampa, and in 2016, Mr. Matricaria moved to Chicago to oversee the Midwest Division. Mr. Matricaria relocated to our headquarters in Calabasas in 2019 as part of his expanded responsibilities. Mr. Matricaria received a B.B.A. in management from the University of Alabama and earned an M.B.A. from St. Thomas University.
 
57

Table of Contents
Gregory A. LaBerge
Mr. LaBerge has served as Senior Vice President and Chief Administrative Officer since 2015. Mr. LaBerge joined the Company in 2005 as an investment broker, became a regional manager in 2008, and was named National Director of our National Hospitality Group in 2012. Prior to that, he worked for 10 years as a management consultant, five years with Ernst & Young, and for Diamond Technology Partners (now part of PricewaterhouseCoopers). His expertise was in working with Fortune 500 companies on strategic and operational initiatives. Mr. LaBerge received his B.A. degree in economics from Northwestern University and his M.B.A. from the Kelley School of Business at Indiana University.
Other Proxy Information
Certain information required by this Item regarding our Audit Committee is incorporated herein by reference to information appearing in our definitive Proxy Statement for our 2021 Annual Meeting of Stockholders (“Proxy Statement”), which information will appear under the caption entitled “Corporate Governance-Board Committees and Charters.”
With regard to the information required by this item relating to compliance with Section 16(a) of the Exchange Act, we will provide disclosure of delinquent Section 16(a) reports, if any, in our Proxy Statement under the caption entitled “Other Matters-Delinquent Section 16(a) Reports” in the Proxy Statement, and such disclosure, if any, is incorporated herein by reference.
Ethical Business Practices
We strive to conduct our business with the highest integrity and standards of ethics and governance that support our values. This includes promoting fair labor practices, upholding human rights, and compliance with legal requirements, including those that address bribery and corruption. This also includes implementing policies, practices, and trainings that convey our expectations and values and meet stakeholder needs.
As part of this effort, we adopted a Code of Ethics. The Code of Ethics does not attempt to identify every possible category of ethical and legal behavior, but instead sets forth the Company’s clear expectations for ethical and honest behavior. The Company is committed to legal compliance, fair dealing, and addressing internal and external ethical concerns, which it does in part through its Ethics Hotline, which allows for anonymous reporting and direct communication with the Company’s Compliance Officer. The Company’s expectations for ethics are further embedded into the Company’s practices through cross-discipline education and trainings, which are provided at the individual, office, and company-wide levels.
The Code of Ethics can be found on www.MarcusMillichap.com by navigating the website as follows:
 
   
From our main web page, click on “NYSE:MMI” at the top of the main web page.
 
   
Next click on “Governance” in the middle navigation bar.
 
   
Then click on “Governance Documents.”
 
   
Finally, click on “Code of Ethics.”
We intend to satisfy the disclosure requirements under Item 5.05(c) of Form
8-K
regarding an amendment to, or waiver from, a provision of the Code of Ethics that applies to our principal executive officer, principal financial officer, principal accounting officer or controller or persons performing similar functions by posting such information on our website, at the address and location specified above.
Item 11. Executive Compensation
The information required by this Item is incorporated herein by reference to information appearing in our Proxy Statement, which information will appear under the caption entitled “Compensation Discussion and Analysis” and “Executive Compensation” in the Proxy Statement.
 
58

Table of Contents
Item 12. Security Ownership of Certain Beneficial Owners and Management and Related Stockholder Matters
The information required by this Item is incorporated herein by reference to information appearing in our Proxy Statement, which information will appear under the captions entitled “Principal Stockholders” in the Proxy statement.
Equity Compensation Plan Information
The following table summarizes information about our equity compensation plans as of December 31, 2021. All outstanding awards relate to our common stock.
 
Plan Category
  
Number of Securities
to be Issued Upon
Exercise of
Outstanding
Options,

Warrants and
Rights
(1)
    
Weighted-
Average Exercise
Price of
Outstanding
Options,
Warrants and
Rights
(2)
    
Number of Securities
Remaining Available
for Future Issuance
Under Equity
Compensation Plans
(Excluding Securities
Reflected in Column
(a))
(3) (4)
 
    
(a)
    
(b)
    
(c)
 
Equity compensation plans approved by security holders
     1,248,806      $ —          4,823,866  
Equity compensation plans not approved by security holders
     —          —          —    


     1,248,806      $  —          4,823,866  


(1)
 
Consists of deferred stock units (“DSUs”) and restricted stock units (“RSUs”) granted under our Amended and Restated 2013 Omnibus Equity Incentive Plan (“2013 Plan”). Excludes restricted stock awards granted under the 2013 Plan, purchase rights granted under our 2013 Employee Stock Purchase Plan (“ESPP”) and cash settled SARs.
(2)
Outstanding DSUs and RSUs have no exercise price.
(3)
Includes 4,667,141 shares available for future issuance under the 2013 Plan. Includes 156,725 shares available for future issuance under the ESPP, including shares subject to purchase during the current offering period, which commenced on November 15, 2021 (the exact number of which will not be known until the purchase date on May 15, 2022). Subject to the number of shares remaining in the share reserve, the maximum number of shares purchasable by any participant on any one purchase date for any purchase period, including the current purchase period may not exceed 1,250 shares.
(4)
Pursuant to the terms of the ESPP, on the first day of each fiscal year, beginning with the 2015 fiscal year, the number of shares authorized for issuance under the ESPP is automatically increased by the lesser of: (i) 366,667 shares of our common stock; (ii) 1% of the outstanding shares of our common stock as of the last day of the immediately preceding fiscal year; or (iii) such other amount as the Board may determine. Pursuant to the provisions of the ESPP, the Board has determined to not provide for any annual increases to date.
Item 13. Certain Relationships and Related Transactions, and Director Independence
Any information required by this Item is incorporated herein by reference to information appearing in our Proxy Statement, which information will appear under the captions entitled “Corporate Governance-Director Independence” and “Certain Relationships and Related Party Transactions” in the Proxy Statement.
Item 14. Principal Accounting Fees and Services
The information required by this Item is incorporated herein by reference to information appearing in our definitive Proxy Statement, which information will appear under the caption entitled “Proposal 2: Ratification of Appointment of Independent Registered Public Accounting Firm for 2022” in the Proxy Statement.
 
59

Table of Contents
PART IV
Item 15. Exhibits, Financial Statement Schedules
 
(a)
The following documents are filed as part of this Report:
 
 
(1)
Consolidated Financial Statements
The consolidated financial statements listed in the accompanying Index to Consolidated Financial Statements are attached to this Form
10-K
beginning on page
F-1.
Reports of Independent Registered Public Accounting Firm
Consolidated Balance Sheets as of December 31, 2021 and 2020
Consolidated Statements of Net and Comprehensive Income for the years ended December 31, 2021, 2020 and 2019
Consolidated Statements of Stockholders’ Equity for the years ended December 31, 2021, 2020 and 2019
Consolidated Statements of Cash Flows for the years ended December 31, 2021, 2020 and 2019
Notes to Consolidated Financial Statements
 
 
(2)
Financial Statement Schedules
The financial statement schedules have been omitted because they are not applicable, or the information required to be set forth therein is included in the consolidated financial statements or notes thereto.
 
(b)
Exhibits
The following exhibits are included herein or incorporated herein by reference:
 
Number
  
Description
    3.1
  
    3.2
  
    4.1
  
    4.2
  
  10.1
  
  10.2†
  
  10.3†
  
 
60

Table of Contents
Number
  
Description
  10.4†
  
  10.5†
  
  10.6†
  
  10.7†
  
  10.8†
  
  10.9†
  
  10.10†
  
  10.11†
  
  10.12
  
  10.13
  
  10.14
  
  10.15†
  
  10.16†
  
  10.17†
  
 
61

Table of Contents
Number
  
Description
  10.18
  
  21.1*
  
  23.1*
  
  31.1*
  
  31.2*
  
  32.1**
  
  101*
  
The following financial statements from the Company’s Annual Report on Form
10-K
for the year ended December 31, 2021, formatted in Inline XBRL: (i) Consolidated Balance Sheets, (ii) Consolidated Statements of Net and Comprehensive Income, (iii) Consolidated Statements of Stockholders’ Equity, (iv) Consolidated Statements of Cash Flows, and (v) Notes to Consolidated Financial Statements, tagged as blocks of text and including detailed tags.
  104*
  
Cover Page Interactive Data File (formatted as Inline XBRL and contained in Exhibit 101)
 
Indicates management contract or compensatory plan.
*
Filed herewith.
**
Furnished, not filed.
 
(c)
Financial Statement Schedules
Not applicable.
Item 16. Form
10-K
Summary
Not applicable.
 
62

Table of Contents
SIGNATURES
Pursuant to the requirements of Section 13 or 15(d) of the Securities Exchange Act of 1934, the registrant has duly caused this report to be signed on its behalf by the undersigned, thereunto duly authorized.
 
Dated: March 1, 2022
 
 
Marcus
 & Millichap, Inc
.
 
 
/s/ Hessam Nadji
 
 
Hessam Nadji
 
 
President and Chief Executive Officer
Pursuant to the requirements of the Securities Exchange Act of 1934, this report has been signed below by the following persons on behalf of the registrant and in the capacities and on the dates indicated.
 
Signature
  
Title
  
Date
/s/ Hessam Nadji
Hessam Nadji
  
Director, President
and Chief Executive Officer
(Principal Executive Officer)
  
March 1, 2022
/s/ Steven F. DeGennaro
Steven F. DeGennaro
  
Chief Financial Officer
(Principal Financial Officer)
  
March 1, 2022
/s/ Kurt H. Schwarz
Kurt H. Schwarz
  
First Vice President of Finance
and Chief Accounting Officer
(Principal Accounting Officer)
  
March 1, 2022
/s/ George M. Marcus
George M. Marcus
  
Director
  
March 1, 2022
/s/ Collete English Dixon
Collete English Dixon
  
Director
  
March 1, 2022
/s/ Norma J. Lawrence
Norma J. Lawrence
  
Director
  
March 1, 2022
/s/ Lauralee E. Martin
Lauralee E. Martin
  
Director
  
March 1, 2022
/s/ Nicholas F. McClanahan
Nicholas F. McClanahan
  
Director
  
March 1, 2022
/s/ George T. Shaheen
George T. Shaheen
  
Director
  
March 1, 2022
/s/ Don C. Watters
Don C. Watters
  
Director
  
March 1, 2022
 
63

Table of Contents
MARCUS & MILLICHAP, INC.
INDEX TO CONSOLIDATED FINANCIAL
STATEMENTS


Page
  
F-2
  
F-6
  
F-7
  
F-8
  
F-9
  
F-10
 
F-1

Table of Contents
Report of Independent Registered Public Accounting Firm
To the Stockholders and Board of Directors of
Marcus & Millichap, Inc.
Opinion on the Financial Statements
We have audited the accompanying consolidated balance sheets of Marcus & Millichap, Inc. (the Company) as of December 31, 2021 and 2020, the related consolidated statements of net and comprehensive income, stockholders’ equity and cash flows for each of the three years in the period ended December 31, 2021, and the related notes (collectively referred to as the “financial statements”). In our opinion, the consolidated financial statements present fairly, in all material respects, the financial position of the Company at December 31, 2021 and 2020, and the consolidated results of its operations and its cash flows for each of the three years in the period ended December 31, 2021, in conformity with U.S. generally accepted accounting principles.
We also have audited, in accordance with the standards of the Public Company Accounting Oversight Board (United States) (PCAOB), the Company’s internal control over financial reporting as of December 31, 2021, based on criteria established in Internal Control— Integrated Framework issued by the Committee of Sponsoring Organizations of the Treadway Commission (2013 framework) and our report dated March 1, 2022 expressed an unqualified opinion thereon.
Basis for Opinion
These financial statements are the responsibility of the Company’s management. Our responsibility is to express an opinion on the Company’s financial statements based on our audits. We are a public accounting firm registered with the PCAOB and are required to be independent with respect to the Company in accordance with the U.S. federal securities laws and the applicable rules and regulations of the Securities and Exchange Commission and the PCAOB.
We conducted our audits in accordance with the standards of the PCAOB. Those standards require that we plan and perform the audit to obtain reasonable assurance about whether the financial statements are free of material misstatement, whether due to error or fraud. Our audits included performing procedures to assess the risks of material misstatement of the financial statements, whether due to error or fraud, and performing procedures that respond to those risks. Such procedures included examining, on a test basis, evidence regarding the amounts and disclosures in the financial statements. Our audits also included evaluating the accounting principles used and significant estimates made by management, as well as evaluating the overall presentation of the financial statements. We believe that our audits provide a reasonable basis for our opinion.
Critical Audit Matter
The critical audit matter communicated below is a matter arising from the current period audit of the financial statements that was communicated or required to be communicated to the audit committee and that: (1) relates to accounts or disclosures that are material to the financial statements and (2) involved our especially challenging, subjective or complex judgments. The communication of the critical audit matter does not alter in any way our opinion on the consolidated financial statements, taken as a whole, and we are not, by communicating the critical audit matter below, providing a separate opinion on the critical matter or on the accounts or disclosures to which it relates.
 
F-2

Table of Contents
Deferred Commissions Payable
 
Description of the Matter
  
At December 31, 2021, the Company’s commissions payable to investment sales and financing professionals was $142.5 million. As discussed in Note 7 to the consolidated financial statements, certain investment sales and financing professionals have the ability to earn additional commissions after meeting certain annual revenue thresholds. All commissions are recognized as cost of services in the period in which they are earned as they relate to specific transactions closed. The Company has the ability to defer payment of certain commissions, at its election, for up to three years. These payments are referred to as deferred commissions.
 
Auditing the Company’s deferred commissions was complex with regard to evaluating the completeness of the population of investment sales and financing professionals eligible for deferred commissions and the accuracy of the investment sales and financing professionals’ revenue thresholds used in determining deferred commissions earned.
 
How We Addressed the Matter in Our Audit
  
We evaluated the design and tested the operating effectiveness of the Company’s internal controls over the deferred commissions process. For example, we tested controls over the completeness and accuracy of the data used in calculating the deferred commissions, including approvals.
 
To test the deferred commissions payable, we performed audit procedures that included, among others, performing a predictive test in which we evaluated the completeness of the deferred commissions schedule based on investment sales and financing professionals’ sales performance. Additionally, we performed procedures to obtain evidence of eligibility approval and performed a hindsight analysis to evaluate the amount of cash disbursed to the amount of deferred commissions payable previously accrued.
/s/ Ernst & Young LLP
We have served as the Company’s auditor since 2013.
Los Angeles, California
March 1, 2022
 
F-3

Table of Contents
Report of Independent Registered Public Accounting Firm
To the Stockholders and Board of Directors of
Marcus & Millichap, Inc.
Opinion on Internal Control over Financial Reporting
We have audited Marcus & Millichap Inc.’s (the Company) internal control over financial reporting as of December 31, 2021, based on criteria established in Internal Control—Integrated Framework issued by the Committee of Sponsoring Organizations of the Treadway Commission (2013 framework) (the COSO criteria). In our opinion, the Company maintained, in all material respects, effective internal control over financial reporting as of December 31, 2021, based on the COSO criteria.
We also have audited, in accordance with the standards of the Public Company Accounting Oversight Board (United States) (PCAOB) the consolidated balance sheets of the Company as of December 31, 2021 and 2020, the related consolidated statements of net and comprehensive income, stockholders’ equity and cash flows for each of the three years in the period ended December 31, 2021, and the related notes and our report dated March 1, 2022 expressed an unqualified opinion thereon.
Basis for Opinion
The Company’s management is responsible for maintaining effective internal control over financial reporting and for its assessment of the effectiveness of internal control over financial reporting included in the accompanying Management’s Report on Internal Control Over Financial Reporting. Our responsibility is to express an opinion on the Company’s internal control over financial reporting based on our audit. We are a public accounting firm registered with the PCAOB and are required to be independent with respect to the Company in accordance with the U.S. federal securities laws and the applicable rules and regulations of the Securities and Exchange Commission and the PCAOB.
We conducted our audit in accordance with the standards of the PCAOB. Those standards require that we plan and perform the audit to obtain reasonable assurance about whether effective internal control over financial reporting was maintained in all material respects.
Our audit included obtaining an understanding of internal control over financial reporting, assessing the risk that a material weakness exists, testing and evaluating the design and operating effectiveness of internal control based on the assessed risk, and performing such other procedures as we considered necessary in the circumstances. We believe that our audit provides a reasonable basis for our opinion.
Definition and Limitations of Internal Control Over Financial Reporting
A company’s internal control over financial reporting is a process designed to provide reasonable assurance regarding the reliability of financial reporting and the preparation of financial statements for external purposes in accordance with generally accepted accounting principles. A company’s internal control over financial reporting includes those policies and procedures that (1) pertain to the maintenance of records that, in reasonable detail, accurately and fairly reflect the transactions and dispositions of the assets of the company; (2) provide reasonable assurance that transactions are recorded as necessary to permit preparation of financial statements in accordance with generally accepted accounting principles, and that receipts and expenditures of the company are being made only in accordance with authorizations of management and directors of the company; and (3) provide reasonable assurance regarding prevention or timely detection of unauthorized acquisition, use, or disposition of the company’s assets that could have a material effect on the financial statements.
 
F-4

Table of Contents
Because of its inherent limitations, internal control over financial reporting may not prevent or detect misstatements. Also, projections of any evaluation of effectiveness to future periods are subject to the risk that controls may become inadequate because of changes in conditions, or that the degree of compliance with the policies or procedures may deteriorate.
/s/ Ernst & Young LLP
Los Angeles, California
March 1, 2022
 
F-5

Table of Contents
MARCUS & MILLICHAP, INC.
CONSOLIDATED BALANCE SHEETS
(in thousands, except for shares and par value)


December 31,


2021
 
  
2020
 
Assets


Current assets:


Cash and cash equivalents
 
$

382,140    
$

243,152  
Commissions receivable, net
    17,230       10,391  
Prepaid expenses
    13,220       10,153  
Marketable debt securities,
available-for-sale
(includes amortized cost of $183,915 and $158,148 at December 31, 2021 and 2020,
 
 
respectively, and $0 allowance for credit losses)
    183,868       158,258  
Advances and loans, net
    6,403       2,413  
Other assets
    5,270       4,711  
Total current assets
    608,131       429,078  
Property and equipment, net
    23,192       23,436  
Operating lease
right-of-use
assets, net
    81,528       84,024  
Marketable debt securities,
available-for-sale
(includes amortized cost of $111,858 and $45,181 at December 31, 2021 and 2020, respectively, and $0 allowance for credit losses)
    112,610       47,773  
Assets held in rabbi trust
    11,508       10,295  
Deferred tax assets, net
    33,736       21,374  
Goodwill and other intangible assets, net
    48,105       52,053  
Advances and loans, net
    113,242       106,913  
Other assets
    13,146       4,176  
Total assets
 
$

1,045,198    
$

779,122  
Liabilities and stockholders’ equity
               
Current liabilities:
               
Accounts payable and other liabilities
 
$

24,271    
$

18,288
 
Deferred compensation and commissions
    114,685       58,106  
Income tax payable
    17,853       3,726  
Operating lease liabilities
    18,973       19,190  
Accrued bonuses and other employee related expenses
    49,848       21,007  
Total current liabilities
    225,630       120,317  
Deferred compensation and commissions
    53,536       38,745  
Operating lease liabilities
    58,334       59,408  
Other liabilities
    11,394       13,816  
Total liabilities
    348,894       232,286  
Commitments and contingencies
                 
Stockholders’ equity:
               
Preferred stock, $0.0001 par value:
               
Authorized shares – 25,000,000; issued and outstanding shares –
none
at December 31, 2021 and 2020, respectively
                 
Common stock, $0.0001 par value:
               
Authorized shares – 150,000,000; issued and outstanding shares – 39,692,373 and 39,401,976 at 
December 31, 2021 and

2020, respectively
    4       4  
Additional
paid-in
capital
    121,844       113,182  
Retained earnings
    573,546       431,076  
Accumulated other comprehensive income
    910       2,574  
Total stockholders’ equity
    696,304       546,836  
Total liabilities and stockholders’ equity
 
$

1,045,198    
$

779,122  
See accompanying notes to consolidated financial statements.
 
F-6

Table of Contents
MARCUS & MILLICHAP, INC.
CONSOLIDATED STATEMENTS OF NET AND COMPREHENSIVE INCOME
(in thousands, except per share amounts)
 
    
Years Ended December 31,
 
    
2021
   
2020
   
2019
 
Revenues:
      
Real estate brokerage commissions
   $ 1,170,969     $ 633,164     $ 729,356  
Financing fees
     109,690       70,538       66,293  
Other revenues
     15,781       13,204       10,779  


Total revenues
     1,296,440       716,906       806,428  


Operating expenses:
      
Cost of services
     840,209       447,879       498,878  
Selling, general and administrative
     255,154       204,514       203,110  
Depreciation and amortization
     11,721       10,899       8,017  


Total operating expenses
     1,107,084       663,292       710,005  


Operating income
     189,356       53,614       96,423  
Other income (expense), net
     4,527       6,650       12,477  
Interest expense
     (580     (900     (1,388


Income before provision for income taxes
     193,303       59,364       107,512  
Provision for income taxes
     50,833       16,526       30,582  


Net income
     142,470       42,838       76,930  


Other comprehensive (loss) income:
                        
Marketable debt securities,
available-for-sale:
                        
Change in net unrealized
gains/
losses
     (1,554     799       1,822  
Less: reclassification adjustment for net losses (gains) included in other income (expense), net
     72       34       (43


Net change, net of tax of $(505), $286 and $611 for the years ended December 31, 2021, 2020 and 2019, respectively
     (1,482     833       1,779  
Foreign currency translation loss, net of tax of $0 for each of the years ended December 31, 2021, 2020 and 2019, respectively
     (182     (237     (576


Total other comprehensive (loss) income
     (1,664     596       1,203  


Comprehensive income
   $ 140,806     $ 43,434     $ 78,133  


Earnings per share:
                        
Basic
   $ 3.57     $ 1.08     $ 1.95  
Diluted
   $ 3.55     $ 1.08     $ 1.95  
Weighted average common shares outstanding:
                        
Basic
     39,888       39,642       39,404  
Diluted
     40,187       39,735       39,548  
See accompanying notes to consolidated financial statements.
 
F-7

Table of Contents
MARCUS & MILLICHAP, INC.
CONSOLIDATED STATEMENTS OF STOCKHOLDERS’ EQUITY
(in thousands, except for shares)


Series A

Redeemable
Preferred
Stock
 
 
Common Stock
 
 
Additional
Paid-In

Capital
 
 
Stock Notes
Receivable

From
Employees
 
 
Retained
Earnings
 
 
Accumulated
Other
Comprehensive
Income (Loss)
 
 
Total


Shares
 
 
Amount
 
 
Shares
 
 
Amount
 
Balance as of December 31, 2018
             $          38,814,464     $ 4     $ 97,458     $  
(4
)

  $ 311,341     $ 775     $ 409,574  
Net and comprehensive income
    —                  —                                    76,930       1,203       78,133  
Stock-based award activity:
                                                                       
Stock-based compensation
                                        9,278                                  9,278  
Issuance of common stock pursuant to employee stock purchase
 
plan
                      21,421                657                                  657  
Issuance of common stock for vesting of restricted stock units
                      378,194                                                        
Issuance of common stock for unvested restricted stock awards
                      12,806                                                        
Shares withheld related to net share settlement of stock-based awards
                      (73,690              (2,735                                (2,735


Balance as of December 31, 2019
                      39,153,195       4       104,658       (4     388,271       1,978       494,907  
Cumulative effect of a change in accounting principle, net of tax
                                                          (33              (33


Balance at January 1, 2020, as adjusted
                      39,153,195       4       104,658       (4     388,238       1,978       494,874  
Net and comprehensive income
    —                  —                                    42,838       596       43,434  
Stock-based award activity:
                                                                       
Stock-based compensation
                                        9,905                                  9,905  
Issuance of common stock pursuant to employee stock purchase
 
plan
                      27,596                642                                  642  
Issuance of common stock for vesting of restricted stock units
                      264,235                                                        
Issuance of common stock for unvested restricted stock awards
                      19,516                                                        
Shares withheld related to net share settlement of stock-based
 
awards
                      (62,566              (2,023                                (2,023
Reduction of stock notes receivable from employees
    —                  —                           4                         4  


Balance as of December 31, 2020
                      39,401,976       4       113,182                431,076       2,574       546,836  
Net and comprehensive income
 (loss)
    —                  —                                    142,470       (1,664     140,806  
Stock-based award activity:
                                                                       
Stock-based compensation
                                        10,361                                  10,361  
Issuance of common stock pursuant to employee stock purchase
 
plan
                      20,152                653                                  653  
Issuance of common stock for settlement of deferred stock units
                      60,373                                                        
Issuance of common stock for vesting of restricted stock units
                      260,525                                                        
Issuance of common stock for unvested restricted stock awards
                      13,323                                                        
Issuance of common stock for stock settled deferred consideration
                      27,481                1,000                                  1,000  
Shares withheld related to net share settlement of stock-based
 
awards
                      (91,457              (3,352                                (3,352


Balance as of December 31, 2021
           $          39,692,373     $ 4     $ 121,844     $        $ 573,546     $ 910     $ 696,304  


See accompanying notes to consolidated financial statements.
 
F-8

Table of Contents
MARCUS & MILLICHAP, INC.
CONSOLIDATED STATEMENTS OF CASH FLOWS
(in thousands)
 
    
Years Ended December 31,
 
    
2021
   
2020
   
2019
 
Cash flows from operating activities
                        
Net income
   $ 142,470     $ 42,838     $ 76,930  
Adjustments to reconcile net income to net cash provided by operating activities:
                        
Depreciation and amortization
     11,721       10,899       8,017  
Noncash lease expense

     23,729       22,825       21,207  
Credit loss expense
     166       188       114  
Stock-based compensation
     10,361       9,905       9,278  
Deferred taxes, net
     (11,845     473       226  
Unrealized foreign exchange losses (gains)
     3,824       (299         
Net realized gains on marketable debt securities,
available-for-sale
     (219     (192     (87
Other
non-cash
items
     641       895       (176
Changes in operating assets and liabilities:
                        
Commissions receivable
     (10,832     (3,290     (55
Prepaid expenses
     (3,066     774       (2,740
Advances and loans
     (12,382     (39,773     (38,655
Other assets
     (3,046     (2,743     (6,521
Accounts payable and other liabilities
     10,175       1,251       (486
Income tax receivable/payable
     14,128       8,724       (9,485
Accrued bonuses and other employee related expenses
     29,073       (2,095     (5,889
Deferred compensation and commissions
     75,047       6,421       (8,975
Operating lease liabilities
     (21,276     (18,461     (17,102
Other liabilities
     (2,766     (252     (314


Net cash provided by operating activities
     255,903       38,088       25,287  


Cash flows from investing activities
                        
Acquisition of businesses, net of cash received
     229       (16,298     (6,083
Purchases of marketable debt securities,
available-for-sale
     (378,106     (215,606     (168,083
Proceeds from sales and maturities of marketable debt securities,
available-for-sale
     285,628       221,677       179,693  
Purchases of securities,
held-to-maturity
     (9,500                  
Issuances of employee notes receivable
     (40     (243     (200
Payments received on employee notes receivable
     290       187       42  
Purchase of property and equipment
     (6,857     (6,945     (8,812
Proceeds from sale of property and equipment
                       21  


Net cash used in investing activities
     (108,356     (17,228     (3,422


Cash flows from financing activities
                        
Taxes paid related to net share settlement of stock-based awards
     (3,352     (2,023     (2,735
Proceeds from issuance of shares pursuant to employee stock purchase plan
     653       642       657  
Principal payments on notes payable to former stockholders
              (6,564     (1,087
Principal payments on stock appreciation rights liability
     (1,481     (1,251     (185
Payments of contingent and deferred consideration
     (1,739     (1,134     (528


Net cash used in financing activities
     (5,919     (10,330     (3,878


Effect of currency exchange rate changes on cash and cash equivalents
     (2,640     (48         


Net increase in cash and cash equivalents
     138,988       10,482       17,987  
Cash and cash equivalents at beginning of year
     243,152       232,670       214,683  


Cash and cash equivalents at end of year
   $ 382,140     $ 243,152     $ 232,670  


Supplemental disclosures of cash flow information
                        
Interest paid during the period
   $ 749     $ 1,223     $ 2,107  


Income taxes paid, net
   $ 48,563     $ 7,329     $ 39,841  


See accompanying notes to consolidated financial statements.
 
F-9

Table of Contents
MARCUS & MILLICHAP, INC.
Notes to Consolidated Financial Statements
 
1.
Description of Business and Basis of Presentation
Description of Business
Marcus & Millichap, Inc., (the “Company”, “Marcus & Millichap”, or “MMI”), a Delaware corporation, is a brokerage firm specializing in commercial real estate investment sales, financing, research and advisory services. As of December 31, 2021, MMI operates 82 offices in the United States and Canada through its wholly-owned subsidiaries, including the operations of Marcus & Millichap Capital Corporation.
Reorganization and Initial Public Offering
MMI was formed in June 2013 in preparation for Marcus & Millichap Company (“MMC”) to
spin-off
its majority owned subsidiary, Marcus & Millichap Real Estate Investment Services, Inc. (“MMREIS”). Prior to the initial public offering (“IPO”) of MMI, all of the preferred and common stockholders of MMREIS (including MMC and employees of MMREIS) contributed all of their outstanding shares to MMI, in exchange for new MMI common stock. As a result, MMREIS became a wholly-owned subsidiary of MMI. Thereafter, MMC distributed 80.0% of the shares of MMI common stock to MMC’s shareholders and exchanged the remaining portion of its shares of MMI common stock for cancellation of indebtedness of MMC. MMI completed its IPO in November 2013.
Basis of Presentation
The Company’s consolidated financial statements have been prepared in accordance with U.S. generally accepted accounting principles (“U.S. GAAP”). The consolidated financial statements include the accounts of the Company and its wholly-owned subsidiaries. All significant intercompany balances and transactions have been eliminated in consolidation.
Considerations Related to the
COVID-19
Pandemic
The Company may continue to experience operational and financial impacts due to the ongoing
COVID-19
pandemic. Actual results may differ from the Company’s current estimates and historical trends due to uncertainties regarding the potential economic impact of new
COVID-19
variants, general population vaccination rates and vaccine mandates on our workforce.
 
2.
Accounting Policies and Recent Accounting Pronouncements
Accounting Policies
Cash and Cash Equivalents
The Company considers cash equivalents to include short-term, highly liquid investments with maturities of three months or less when purchased. Portions of the balance of cash and cash equivalents were held in financial institutions, various money market funds with fixed and floating net asset values and short-term commercial paper. Money market funds have floating net asset values and may be subject to gating or liquidity fees. The Company assesses short-term commercial paper for impairment in connection with investments in marketable debt securities,
available-for-sale.
The likelihood of realizing material losses from cash and cash equivalents, including the excess of cash balances over federally insured limits, is remote.
Revenue Recognition
The Company generates real estate brokerage commissions by acting as a broker for real estate owners or investors seeking to buy or sell commercial properties. The Company generates financing fees from securing
 
F-10

Table of Contents
MARCUS & MILLICHAP, INC.
Notes to Consolidated Financial Statements
 
financing on purchase transactions, from refinancing its clients’ existing mortgage debt and other ancillary fees associated with financing activities, including, but not limited to, mortgage servicing, debt and equity advisory services, loan sales and other consulting and due diligence services. The Company recognizes mortgage servicing revenues upon the acquisition of a servicing contract. The Company records servicing fees when earned provided the loans are current and the debt service payments are made by the borrowers. Other revenues include fees generated from consulting and advisory services, as well as referral fees from other real estate brokers. The Company’s contracts contain one performance obligation related to its real estate brokerage, financing and consulting and advisory services offered to buyers and sellers of commercial real estate, and provide that it is operating as a principal in all its revenue generating activities. The Company does not have multiple-element arrangements, variable consideration, financing components, significant noncash consideration, licenses, long-term contracts with customers or other items affecting the transaction price. Accordingly, the Company determined that the transaction price is fixed and determinable and collectability is reasonably assured. The Company recognizes revenue in principally all cases at the close of escrow for real estate brokerage, at the close of loan for financing, when services are provided, or upon closing of the transaction for other revenues.
Capitalization of Internal Software
Certain costs related to the development or purchase of
internal-use
software are capitalized. Internal costs that are incurred in the preliminary project stage are expensed as incurred. Direct consulting costs and certain payroll and related costs that are incurred during the development stage of a project are capitalized and depreciated using the straight-line method over a useful life of five years. Capitalized costs are recorded in property and equipment, net, and depreciation is recorded in depreciation and amortization in the consolidated financial statements. Depreciation begins for software that has been placed into production and is ready for its intended use. Post-implementation costs such as training, maintenance and support are expensed as incurred. The Company evaluates the carrying value of capitalized software for impairment whenever events or changes in circumstances indicate that the carrying amount of such assets may not be recoverable.
Commissions Receivable, Net
Commissions receivable, net consists of commissions earned on brokerage and financing transactions for which payment has not yet been received. The Company evaluates the need for an allowance for credit losses based on consideration of historical experience, current conditions and forecasts of future economic conditions. The majority of commissions receivable are settled within 10 days after the close of escrow.
Advances and Loans, Net
Advances and loans, net includes amounts advanced and loans due from the Company’s investment sales and financing professionals.
In order to attract and retain highly skilled professionals, from time to time, the Company advances funds to its investment sales and financing professionals. The advances are typically in the form of forgivable loans that have terms that are generally between five and ten years.
 
The principal amount of a forgivable loan and accrued interest are forgiven over the term of the loan, so long as the investment sales and financing professionals continue to be a service provider with the Company, and/or upon achieving contractual performance criteria. Amounts forgiven are charged to selling, general and administrative expense over the period forgiven. If the investment sales and financing professional’s relationship with the Company is terminated before the amount advanced is forgiven, the unforgiven amount becomes due and payable. The Company evaluates the need for an allowance for credit losses based on amounts advanced, expected forgiveness, consideration of historical experience, current conditions and forecasts of future economic conditions. Estimated credit losses, net of any
 
F-11

Table of Contents
MARCUS & MILLICHAP, INC.
Notes to Consolidated Financial Statements
 
reversals, are charged to credit loss expense included in selling, general and administrative expense. Amounts are generally written off when amounts are determined to be no longer collectable. Accrued interest, when applicable, has historically been immaterial.
The Company, from time to time, enters into various agreements with certain of its investment sales and financing professionals whereby these individuals receive loans. The notes receivable, along with stated interest, are typically collected from future commissions or repaid based on the terms stipulated in the respective agreements that are generally between one and seven years. The Company evaluates the need for an allowance for credit losses for the loans based on historical experience, current conditions and reasonable forecasts of future economic conditions. Estimated credit losses, net of any reversals, are charged to credit loss expense included in selling, general and administrative expense. Amounts are generally written off when amounts are determined to be no longer collectable.
Cost of Services
Cost of services principally consists of variable commissions, compensation-related costs related to the Company’s financing activities, and other costs for the Company’s investment sales and financing professionals related to transactions closed in the period. Commissions are accrued based on revenue from transactions generated by the Company’s investment sales and financing professionals. Investment sales and financing professionals are compensated at commission rates based on individual agreements, and a portion of the commissions due upon the closing of a transaction may be deferred in accordance with their contracts. Some of our most senior investment sales and financing professionals also have the ability to earn additional commissions after meeting certain annual financial thresholds. These additional commissions are recognized as cost of services in the period in which they are earned. Payment of a portion of these additional commissions are generally deferred for a period of one to three years, at our election, and paid at the beginning of the second and fourth calendar year. These deferred commissions are included in deferred compensation and commissions (current and
non-current)
captions in the accompanying consolidated balance sheets. Cost of services also includes referral fees paid to other real estate brokers where we are the principal service provider.
Investments in Marketable Debt Securities,
Available-for-Sale
The Company maintains a portfolio of investments in a variety of fixed and variable rate debt securities, including U.S. treasuries, U.S. government sponsored entities, corporate debt, asset-backed securities (“ABS”) and other. The Company considers its investments in marketable debt securities to be
available-for-sale,
and accordingly, are recorded at their fair values. The Company determines the appropriate classification of investments in marketable debt securities at the time of purchase. Interest along with amortization of purchase premiums and accretion of discounts from the purchase date through the estimated maturity date, including consideration of variable maturities and contractual call provisions, are included in other income (expense), net in the consolidated statements of net and comprehensive income. The Company typically invests in highly rated debt securities, and its investment policy generally limits the amount of credit exposure to any one issuer. The policy requires substantially all investments to be investment grade, with the primary objective of minimizing the potential risk of principal loss and matching long-term liabilities. See Note 5 – “Investments in Marketable Debt Securities,
Available-for-Sale”
for additional information.
The Company reviews quarterly its investment portfolio of all securities in an unrealized loss position to determine if an impairment charge or credit reserve is required. The Company excludes accrued interest from both the fair value and the amortized cost basis of marketable debt securities,
available-for-sale,
for the purposes of identifying and measuring an impairment. An investment is impaired if the fair value is less than its amortized cost basis. Impairment relating to credit losses is recorded through a reduction in the amortized cost of the
 
F-12

Table of Contents
MARCUS & MILLICHAP, INC.
Notes to Consolidated Financial Statements
 
security or an allowance for credit losses and credit loss expense (included in selling, general and administrative expense), limited by the amount that the fair value is less than the amortized cost basis. Impairment that has not been recorded as a credit loss is recorded through other comprehensive income (loss), net of applicable taxes. The Company made an accounting policy election to not measure an allowance for credit losses for accrued interest receivables. The Company evaluates
write-off
of accrued interest receivable by the major security-type level at the time credit loss exists for the underlying security.
Determining whether a credit loss exists requires a high degree of judgment and the Company considers both qualitative and quantitative factors in making its determination. The Company evaluates its intent to sell, or whether the Company will more likely than not be required to sell, the security before recovery of its amortized cost basis. For all securities in an unrealized loss position, the Company evaluates, among other items, the extent and length of time the fair market value of a security is less than its amortized cost, time to maturity, duration, seniority, the financial condition of the issuer including credit ratings, any changes thereto and relative default rates, leverage ratios, availability of liquidity to make principle and interest payments, performance indicators of the underlying assets, analyst reports and recommendations, and changes in base and market interest rates. If the qualitative and quantitative analysis is sufficient to conclude that an impairment related to credit losses does not exist, the Company typically does not perform further quantitative analysis to estimate the present value of cash flows expected to be collected from the debt security. Estimates of expected future cash flows are the Company’s best estimate based on past events, current conditions and reasonable and supportable economic forecasts.
Assets Held in Rabbi Trust
The Company maintains a
non-qualified
deferred compensation program for certain employees. Deferred amounts are invested in variable whole life insurance policies owned by the Company supporting the deferred obligation and are held in a rabbi trust. Participants elect to invest in various hypothetical equity and debt securities offered within the plan on a notional basis. The net change in the carrying value of the underlying assets held in the rabbi trust is recorded in other income (expense), net. The change in the deferred compensation liability as a result of the change in the notional value of the participants accounts is recorded as a component of selling, general and administrative expense in the consolidated statements of net and comprehensive income.
Fair Value Measurements
U.S. GAAP defines the fair value of a financial instrument as the amount that would be received from the sale of an asset in an orderly transaction between market participants at the measurement date. The Company is responsible for the determination of fair value and the supporting methodologies and assumptions. The Company uses various pricing sources and third parties to provide and validate the values utilized.
The degree of judgment used in measuring the fair value of financial instruments is generally inversely correlated with the level of observable valuation inputs. Financial instruments with quoted prices in active markets generally have more pricing observability and less judgment is used in measuring fair value. Financial instruments for which no quoted prices are available have less observability and are measured at fair value using valuation models or other pricing techniques that require more judgment.
Assets recorded at fair value are measured and classified in accordance with a fair value hierarchy consisting of the three “levels” based on the observability of inputs available in the marketplace used to measure the fair values as discussed below:
 
   
Level
 1:
Unadjusted quoted prices in active markets that are accessible at the measurement date for identical, unrestricted assets or liabilities;
 
F-13

Table of Contents
MARCUS & MILLICHAP, INC.
Notes to Consolidated Financial Statements
 
   
Level
 2:
Quoted prices in markets that are not active, or inputs which are observable, either directly or indirectly, for substantially the full term of the asset or liability; or
 
   
Level
 3:
Unobservable inputs reflect management’s best estimate of what market participants would use in pricing the asset or liability at the measurement date. Consideration is given to the risk inherent in the valuation technique and the risk inherent in the inputs to the model. Management estimates include certain pricing models, discounted cash flow methodologies and similar techniques that use significant unobservable inputs.
Recurring Fair Value Measurements
The Company values its investments including commercial paper and floating NAV money market funds recorded in cash and cash equivalents, investments in marketable debt securities,
available-for-sale,
assets held in the rabbi trust, deferred compensation liability and contingent and deferred consideration at fair value on a recurring basis.
Fair values for investments included in cash and cash equivalents and marketable debt securities,
available-for-sale,
were determined for each individual security in the investment portfolio and all these securities are Level 1 or 2 measurements as appropriate.
Fair values for assets held in the rabbi trust and related deferred compensation liability were determined based on the cash surrender value of the company owned variable life insurance policies and underlying investments in the trust, and are Level 2 and Level 1 measurements, respectively.
Contingent consideration in connection with acquisitions, is carried at fair value and determined on a
contract-by-contract
basis, calculated using unobservable inputs based on a probability of achieving EBITDA and other performance requirements (refer to Note 9 – “Fair Value Measurements”), and is a Level 3 measurement. Deferred consideration in connection with acquisitions is carried at fair value and calculated using a discounted cash flow estimate with the only remaining condition on such payments being the passage of time, and is a Level 2 measurement.
Nonrecurring Fair Value Measurements
In accordance with U.S. GAAP, from time to time, the Company measures certain assets at fair value on a nonrecurring basis. The Company reviews the carrying value of mortgage servicing rights (“MSRs”), intangibles, goodwill and other assets for indications of impairment at least annually. When indications of potential impairment are identified, the Company may be required to determine the fair value of those assets and record an adjustment for the carrying amount in excess of the fair value determined. Any fair value determination would be based on valuation approaches, which are appropriate under the circumstances and utilize Level 2 and Level 3 measurements as required.
Assets and Liabilities not Measured at Fair Value
The Company’s commissions receivable, amounts due from employees and investment sales and financing professionals (included in the other assets, net current and other assets
non-current
captions), accounts payable and other liabilities and commissions payable (included in deferred compensation and commissions current and deferred compensation and commissions
non-current
captions) are carried at cost, which approximates fair value based on their immediate or short-term maturities and terms which approximate current market rates.
 
F-14

Table of Contents
MARCUS & MILLICHAP, INC.
Notes to Consolidated Financial Statements
 
The Company’s obligations under stock appreciation rights (“SARs”) liability (included in the deferred compensation and commissions current and deferred compensation and commissions
non-current
captions) bear interest at a variable rate based on U.S. Treasuries, and the Company has determined that the carrying value approximates their fair value.
Property and Equipment, Net
Property and equipment are stated at cost less accumulated depreciation and amortization. The Company uses the straight-line method for depreciation and amortization. Depreciation and amortization are generally provided over estimated useful lives ranging from three to seven years.
The Company evaluates its fixed assets for impairment whenever events or changes in circumstances indicate that the carrying amount of an asset may not be recoverable.
Other Assets
Other assets consist primarily of securities,
held-to-maturity,
MSRs, security deposits made in connection with operating leases, customer trust accounts, employee notes receivable and other assets and receivables. In connection with a brokerage transaction, the Company may need to, or be required to, hold cash in escrow for a transaction participant. These amounts are deposited into separate customer trust accounts controlled by the Company. The amounts are included in current other assets, net, with a corresponding liability included in accounts payable and other liabilities, both in the consolidated balance sheets.
MSRs are recorded at fair value upon acquisition of a servicing contract. The Company has elected the amortization method for the subsequent measurement of MSRs. MSRs are carried at the lower of amortized cost or fair value. All MSRs are amortized using the interest method over the period that servicing income is expected to be received. MSRs are included in other assets
non-current
in the accompanying consolidated balance sheets. See Note 7 – “Selected Balance Sheet Data” for additional information. Amortization related to the MSRs is included in depreciation and amortization expense in the accompanying consolidated statements of net and comprehensive income.
The Company measures MSRs at fair value on a nonrecurring basis. MSRs are a Level 3 measurement. The Company’s MSRs do not trade in an active, open market with readily observable prices. The estimated fair value of the Company’s MSRs were developed using a discounted cash flow model that calculates the present value of estimated future net servicing income. The model considers contractual provisions and assumptions of market participants including specified servicing fees, prepayment assumptions, delinquency rates, late charges, other ancillary revenue, costs to service and other economic factors. The Company periodically reassesses and adjusts, when necessary, the underlying inputs and assumptions used in the model to reflect observable market conditions and assumptions that a market participant would consider in valuing an MSR asset.
In connection with MSR activities, the Company holds funds in escrow for the benefit of the lenders. These funds and the offsetting obligations are not presented in the Company’s consolidated financial statements as they do not represent assets and liabilities of the Company.
Leases
The Company utilizes operating leases for all its facilities and autos. The Company determines if an arrangement is a lease at inception.
Right-of-use
assets (“ROU assets”) represent the Company’s right to use an underlying asset for the lease term and lease liabilities represent the Company’s contractual obligation to make lease payments under the lease. Operating leases are included in operating lease ROU assets,
non-current,
and operating lease liabilities current and
non-current
captions in the consolidated balance sheets.
 
F-15

Table of Contents
MARCUS & MILLICHAP, INC.
Notes to Consolidated Financial Statements
 
Operating lease ROU assets and liabilities are recognized on the commencement date based on the present value of lease payments over the lease term. Lease agreements may contain periods of free rent or reduced rent, predetermined fixed increases in the minimum rent and renewal or termination options, all of which add complexity and impact the determination of the lease term and lease payments to be used in calculating the lease liability. Certain facility leases provide for rental escalations related to increases in the lessors’ direct operating expenses. The Company uses the implicit rate in the lease when determinable. As most of the Company’s leases do not have a determinable implicit rate, determining the rate to be used in its calculations is judgmental. The Company uses an estimated incremental borrowing rate based on borrowing options under its credit agreement and applies a spread over treasury rates for the indicated term of the lease based on the information available on the commencement date of the lease. The Company typically leases general purpose
built-out
office space, which reverts to the lessor upon termination of the lease. Any payments for completed improvements, determined to be owed by the lessor, net of incentives received, are recorded as an increase to the ROU asset and considered in the determination of the lease cost.
The Company has lease agreements with lease and
non-lease
components, which are accounted for as a single lease component. Lease cost is recognized on a straight-line basis over the lease term. Variable lease payments consist of common area costs, insurance, taxes, utilities, parking and other lease related costs, which are determined principally based on billings from landlords.
Litigation
The Company is subject to various legal proceedings and claims that arise in the ordinary course of business, some of which involve claims for damages that are substantial in amount. Most of these litigation matters are covered by insurance, which contain deductibles, exclusions, claim limits and aggregate policy limits. While the ultimate liability for these legal proceedings cannot be determined, the Company uses judgment in the evaluation of claims and the need for accrual for loss contingencies quarterly. The Company records an accrual for litigation related losses where the likelihood of loss is both probable and estimable. The Company accrues legal fees for litigation as the legal services are provided.
Advertising Costs
Advertising costs are expensed as incurred. Advertising costs are included in selling, general and administrative expense in the accompanying consolidated statements of net and comprehensive income.
Advertising costs for the years ended December 31, 2021, 2020 and 2019 were $830,000, $586,000 and $889,000 respectively.
Income Taxes
The Company accounts for income taxes under the asset and liability method. The Company recognizes deferred tax assets and liabilities for the future tax consequences attributable to (i) differences between the financial statement carrying amounts of existing assets and liabilities and their respective tax basis, and (ii) operating losses and tax credit carryforwards. The Company measures existing deferred tax assets and liabilities using enacted tax rates expected to apply to taxable income in the years in which the Company expects to have temporary differences realized or settled. The Company recognizes in the provision for income taxes, the effect on deferred tax assets and liabilities of a change in tax rates in the period that includes the enactment date. The Company periodically evaluates deferred tax assets to assess whether it is likely that the deferred tax assets will be realized. In determining whether a valuation allowance is required, the Company considers the timing of deferred tax reversals, current year taxable income and historical performance. Valuation allowances are provided against deferred tax assets when it is
more-likely-than-not
that some portion or all of the deferred tax asset will not be realized.
 
F-16

Table of Contents
MARCUS & MILLICHAP, INC
.
Notes to Consolidated Financial Statements
 

Because of the nature of the Company’s business, which includes activity in the U.S. and Canada, incorporating numerous states and provinces as well as local jurisdictions, the Company’s tax position can be complex. As such, the Company’s effective tax rate is subject to changes as a result of fluctuations in the mix of its activity in the various jurisdictions in which the Company operates including changes in tax rates, state apportionment, tax related interest and penalties, valuation allowances and other permanent items. Calculating some of the amounts involves a high degree of judgment.
The Company evaluates its tax positions quarterly. The threshold for recognizing the benefits of tax return positions in the financial statements is “more likely than not” to be sustained by the taxing authority and requires measurement of a tax position meeting the
more-likely-than-not
criterion, based on the largest benefit that is more than
 
50
% likely to be realized. The Company assesses its inventory of tax positions with respect to all applicable income tax issues for all open tax years (in each respective jurisdiction) and determines whether uncertain tax positions are required to be recognized in the Company’s consolidated financial statements.
The Company recognizes interest and penalties incurred as income tax expense.
Stock-Based Compensation
The Company follows the accounting guidance for share-based payments, which requires the measurement and recognition of compensation expense for all stock-based awards made to employees, independent contractors and
non-employee
directors. Awards are issued under the Amended and Restated 2013 Omnibus Equity Incentive Plan (“2013 Plan”) and 2013 Employee Stock Purchase Plan (“ESPP”).
For awards made to the Company’s employees, directors and independent contractors, the Company initially values restricted stock units (“RSUs”) and restricted stock awards (“RSAs”) based on the grant date closing price of the Company’s common stock. For awards with periodic vesting, the Company recognizes the related expense on a straight-line basis over the requisite service period for the entire award, subject to periodic adjustments to ensure that the cumulative amount of expense recognized through the end of any reporting period is at least equal to the portion of the grant date value of the award that has vested through that date. The Company accounts for forfeitures prospectively as they occur.
If there are any modifications or cancellations of the underlying unvested share-based awards, the Company may be required to accelerate, increase or cancel any remaining unrecognized or previously recorded stock-based compensation expense.
For shares issued under the ESPP, the Company determined that the plan was a compensatory plan and is required to expense the fair value of the awards over each
six-month
offering period. The Company estimates the fair value of these awards using the Black-Scholes option pricing model. The Company calculates the expected volatility based on the historical volatility of the Company’s common stock and the risk-free interest rate based on the U.S. Treasury yield curve in effect at the time of grant, both consistent with the term of the offering period. The Company incorporates no forfeiture rate and includes no expected dividend yield as the Company has not
 previously paid dividends.
Earnings per Share
Basic weighted average shares outstanding includes vested, but
un-issued,
deferred stock units (“DSUs”). The difference between basic and diluted weighted average shares outstanding represents the dilutive impact of common stock equivalents consisting of shares to be issued under the 2013 Plan and ESPP and contingently issuable shares in connection with stock settled consideration for acquired businesses.
 
F-17

Table of Contents
MARCUS & MILLICHAP, INC
.
Notes to Consolidated Financial Statements
 

Foreign Currency Translation
The Company prepares the financial statements of its Canadian subsidiary using the local currency as the functional currency. The assets and liabilities of the Company’s Canadian subsidiary are translated into U.S. dollars at the rates of exchange at the balance sheet date with the resulting translation adjustments included as a separate component of stockholder’s equity through other comprehensive income (loss) in the consolidated statements of net and comprehensive income.
Income and expenses are translated at the average monthly rates of exchange. The Company includes realized gains and losses from foreign currency transactions in other income (expense), net in the consolidated statements of net and comprehensive income.
The effect of foreign currency translation on cash and cash equivalents is reflected in cash flows from operating activities on the consolidated statements of cash flows, and is not material for any period presented.
Taxes Collected from Clients and Remitted to Governmental Authorities
The Company accounts for tax assessed by any governmental authority that is based on revenue or transaction value (e.g. sales, use and value added taxes) on a net basis, and, accordingly, such amounts are not included in revenue. Collected amounts are recorded as a current liability until paid.
Use of Estimates
The preparation of consolidated financial statements in conformity with U.S. GAAP requires management to make estimates and assumptions that affect the reported amounts of assets and liabilities and the related disclosures at the date of the consolidated financial statements and the reported amounts of revenues and expenses during the reporting period. Actual results could differ from those estimates.
Concentrations of Credit Risk
Financial instruments that potentially subject the Company to a concentration of credit risk principally consist of cash and cash equivalents, investments in marketable debt securities,
available-for-sale,
security deposits (included under other assets,
non-current)
and commissions receivable, net. Cash and cash equivalents are placed with high-credit quality financial institutions and invested in high-credit quality money market funds and commercial paper. Concentrations and ratings of marketable debt securities,
available-for-sale
are limited by the approved investment policy.
To reduce its credit risk, the Company monitors the credit standing of the financial institutions money market funds that represent amounts recorded as cash and cash equivalents. The Company historically has not experienced any significant losses related to cash and cash equivalents.
The Company derives its revenues from a broad range of real estate investors, owners, and users in the United States and Canada, none of which individually represents a significant concentration of credit risk. The Company maintains allowances, as needed, for estimated credit losses based on management’s assessment of the likelihood of collection. For the years ended December 31, 2021, 2020 and 2019, no transaction represented 10% or more of total revenues. Further, while one or more transactions may represent 10% or more of commissions receivable at any reporting date, amounts due are typically collected within 10 days of settlement and, therefore, do not expose the Company to significant credit risk.
 
F-18

Table of Contents
MARCUS & MILLICHAP, INC.
Notes to Consolidated Financial Statements
 
During the year ended December 31, 2021, the Company’s Canadian operations represented approximately 2% of total revenues. During the years ended December 31, 2020 and 2019, the Company’s Canadian operations represented less than 2% and 1% of total revenues, respectively.
During each of the years ended December 31, 2021, 2020 and 2019, no office represented 10% or more of total revenues.
Business Combinations
The Company accounts for business combinations using the acquisition method of accounting, under which the consideration for the acquisition, including the fair value of any contingent and deferred consideration, is allocated to the assets acquired and liabilities assumed. The Company recognizes identifiable assets acquired and liabilities assumed at their acquisition date fair values as determined by management as of the acquisition date. The excess of the consideration over the assets acquired net of liabilities assumed is recognized as goodwill. During the measurement period, which is not to exceed one year from the acquisition date, the Company may record adjustments to the assets acquired and liabilities assumed, with the corresponding offset to goodwill. Upon the conclusion of the measurement period, any subsequent adjustments are recorded as expense in the consolidated statements of net and comprehensive income.
In connection with certain acquisitions, the Company enters into agreements to pay additional cash amounts based on the achievement of certain performance measures and/or service and time requirements. Contingent and deferred consideration in connection with the acquisition of a business is measured at fair value on the acquisition date and remeasured at fair value each reporting period thereafter until the consideration is settled in cash or stock, with changes in fair value recorded in selling, general and administrative expense in the consolidated statements of net and comprehensive income.
Acquisition-related costs, such as due diligence, legal and accounting fees, are expensed as incurred and not considered in determining the fair value of the acquired assets. Acquisition-related costs are reflected in selling, general and administrative expense in the consolidated statements of net and comprehensive income.
Goodwill and Other Intangible Assets
The Company evaluates goodwill for impairment annually in the fourth quarter. In addition to the annual impairment evaluation, the Company evaluates at least quarterly whether events or circumstances have occurred in the period subsequent to the annual impairment testing which indicate that it is more likely than not an impairment loss has occurred. The initial impairment evaluation of goodwill is a qualitative assessment and is performed to assess whether the fair value of a reporting unit (“RU”) is less than its carrying amount. The Company completes a quantitative impairment test if evidence from the qualitative assessment indicates that it is more likely than not that the fair value of the RU is less than its carrying amount. If the Company determines the quantitative impairment test is required, the estimated fair value of the RU is determined and compared to its carrying amount, including goodwill. If the carrying amount exceeds the estimated fair value, an impairment loss is recognized equal to that excess. The loss recognized cannot exceed the carrying amount of goodwill. The Company currently has only one RU, therefore,
 
all goodwill is allocated to that
one
RU.
The Company evaluates its finite-lived intangible assets for impairment at least annually, or as events or changes in circumstances indicate the carrying value may not be recoverable. The Company records an impairment loss if impairment triggers exist and the fair value of the asset is less than the asset’s carrying amount. The Company measures recoverability by comparing the carrying amount to the future undiscounted cash flows that the intangible assets are expected to generate. If the carrying value of the intangible assets are not
 
F-19

Table of Contents
MARCUS & MILLICHAP, INC.
Notes to Consolidated Financial Statements
 
recoverable, the impairment recognized is measured as the amount by which the carrying value exceeds its fair value. The Company’s intangible assets primarily include
non-compete
agreements, customer relationships and contracts in progress that resulted from its business combinations. These intangible assets are generally amortized on a straight-line basis using a useful life between one and seven years.
Segment Reporting
The Company follows U.S. GAAP for segment reporting, which requires reporting information on operating segments in interim and annual financial statements. Substantially all of the Company’s operations involve the delivery of commercial real estate services to its customers including real estate investment sales, financing and consulting and advisory services. Management makes operating decisions, assesses performance and allocates resources based on an ongoing review of these integrated operations, which constitute the Company’s only operating segment for financial reporting purposes.
Recent Accounting Pronouncements
Pending Adoption
In March 2020, the FASB issued Accounting Standards Update (“ASU”)
No. 2020-04,
Reference Rate Reform (Topic 848): Facilitation of the Effects of Reference Rate Reform on Financial Reporting
(“ASU
2020-04”).
ASU
2020-04
provides temporary optional exceptions to the guidance in U.S. GAAP on contract modifications to ease the financial reporting burdens related to the expected market transition from the London Interbank Offered Rate (“LIBOR”) and other interbank offered rates to alternative reference rates, such as the Secured Overnight Financing Rate (“SOFR”). ASU
2020-04
is effective for all entities upon issuance and may be applied prospectively to contract modifications through December 31, 2022. The guidance applies to the Company’s Credit Agreement (see Note 15 – “Commitments and Contingencies”), which references LIBOR, and will generally allow it to account for and present a modification as an event that does not require contract remeasurement at the modification date or reassessment of a previous accounting determination. As of December 31, 2021, the Company has not drawn funds from the credit facility. The Company continues to evaluate the impact of this new standard but does not expect ASU
2020-04
to have a material effect on its
consolidated financial statements.

 
3.
Property and Equipment, Net
Property and equipment, net consisted of the following (in thousands):
 
    
December 31,
 
    
2021
    
2020
 
Computer software and hardware equipment
   $ 33,819      $ 30,955  
Furniture, fixtures and equipment
     24,511        23,418  
Less: accumulated depreciation and amortization
     (35,138      (30,937


     $ 23,192      $ 23,436  


During the years ended December 31, 2021 and 2020, the Company
wrote-off
approximately $3.2 million and $1.3 million, respectively, of fully depreciated computer software and hardware equipment and furniture, fixtures and equipment.
As of December 31, 2021 and 2020, property and equipment additions incurred but not yet paid included in accounts payable and other liabilities were $406,000 and $154,000, respectively.
 
F-20

Table of Contents
MARCUS & MILLICHAP, INC.
Notes to Consolidated Financial Statements
 
4.
Operating Leases
The Company has operating leases for all of its facilities and autos. 
The operating lease cost, included in selling, general and administrative expense in the consolidated statement of net and comprehensive income, consisted of the following (in thousands):


Years Ended
December 31,


2021
 
  
2020
 
Operating lease cost:


Lease cost 
   $ 26,209      $ 25,508  
Variable lease cost
(
1
)
     5,371        5,438  
Sublease income
     (492      (246


     $ 31,088      $ 30,700  


​​​​​​​


​​​​​​​
 
(
1
)
Primarily relates to common area maintenance, property taxes, insurance, utilities and parking.
Maturities of lease liabilities by year consisted of the following (in thousands):
 
    
December 31,
2021
 
2022
   $  20,901  
2023
     17,728  
2024
     15,224  
2025
     12,814  
2026
     9,335  
Thereafter
     6,738  


Total future minimum lease payments
     82,740  
Less imputed interest
     (5,433


Present value of operating lease liabilities
   $  77,307  


Supplemental cash flow information and noncash activity related to the operating leases consisted of the following (in thousands):


Years Ended
December 31,


2021
 
  
2020
 
Operating cash flow information:


Cash paid for amounts included in the measurement of operating lease
 
liabilities
   $
 
23,662      $
 
21,131  
Noncash activity:
                 
ROU assets obtained in exchange for operating lease liabilities
   $ 19,981      $ 16,293  
Tenant improvements owned by lessor related to ROU assets
(1)
   $ 1,266      $ 971  
 
(1)
Reclassification from other assets current.
F-21

Table of Contents
MARCUS & MILLICHAP, INC
.
Notes to Consolidated Financial Statements

 
Other information related to the operating leases consisted of the following:


December 31,


2021
 
 
2020
 
Weighted average remaining operating lease term
     4.57 years       4.70 years  
Weighted average discount rate
     2.9     3.1
 
5.
Investments in Marketable Debt Securities,
Available-for-Sale
Amortized cost, allowance for credit losses, gross unrealized gains/losses in accumulated other comprehensive income/loss and fair value of marketable debt securities,
available-for-sale,
by type of security consisted of the following (in thousands):


December 31, 2021


Amortized
Cost
 
  
Allowance
for Credit
Losses
 
  
Gross
Unrealized
Gains
 
  
Gross
Unrealized
Losses
 
 
Fair

Value
 
Short-term investments:


U.S. treasuries
   $ 35,767      $     
 
  
     $         $      
 
(34
  $ 35,733  
Corporate debt
     148,148                  22        (35     148,135  


     $ 183,915      $         $ 22      $ (69   $ 183,868  


Long-term investments:
                                           
U.S. treasuries
   $ 70,902      $         $ 128      $ (263   $ 70,767  
U.S. government sponsored entities
     726                  22        (3     745  
Corporate debt
     33,197                  962        (146     34,013  
ABS and other
     7,033                  82        (30     7,085  


     $ 111,858      $         $  1,194      $ (442   $ 112,610  


December 31, 2020


Amortized
Cost
 
  
Allowance
for Credit
Losses
 
  
Gross
Unrealized
Gains
 
  
Gross
Unrealized
Losses
 
 
Fair

Value
 
Short-term investments:


U.S. treasuries
   $ 75,887      $     
 
   
     $ 88      $ (5   $ 75,970  
U.S. government sponsored entities
     32,439                  8                 32,447  
Corporate debt
     49,822                  20        (1     49,841  


     $ 158,148      $         $ 116      $ (6   $ 158,258  


Long-term investments:
                                           
U.S. treasuries
   $ 3,375      $         $ 266      $        $ 3,641  
U.S. government sponsored entities
     1,114                  38                 1,152  
Corporate debt
     34,183                  2,137        (33     36,287  
ABS and other
     6,509                  195        (11     6,693  


     $ 45,181      $         $ 2,636      $ (44   $ 47,773  


F-22

Table of Contents
MARCUS &
MILLICHAP
, INC.
Notes to Consolidated Financial Statements
 
The Company’s investments in marketable debt securities,
available-for-sale,
that have been in a continuous unrealized loss position, for which an allowance for credit losses has not been recorded, by type of security consisted of the following (in thousands):
 
    
December 31, 2021
 
    
Less than 12 months
   
12 months or greater
   
Total
 
    
Fair

Value
    
Gross
Unrealized
Losses
   
Fair

Value
    
Gross
Unrealized
Losses
   
Fair

Value
    
Gross
Unrealized
Losses
 
U.S. treasuries
   $ 103,019      $ (297   $          $             $ 103,019      $ (297
U.S. government sponsored entities
     115        (3                        115        (3
Corporate debt
     115,908        (173     146        (8     116,054        (181
ABS and other
     2,915        (30                        2,915        (30


     $ 221,957      $ (503   $      146      $ (8   $ 222,103      $ (511


December 31, 2020


Less than 12 months
 
 
12 months or greater
 
 
Total


Fair

Value
 
  
Gross
Unrealized
Losses
 
 
Fair

Value
 
  
Gross
Unrealized
Losses
 
 
Fair

Value
 
  
Gross
Unrealized
Losses
 
U.S. treasuries
   $ 41,702      $  (5   $         $             $ 41,702      $      (5
Corporate debt
     29,810        (34                        29,810        (34
ABS and other
     546        (6     157        (5     703        (11


     $ 72,058      $ (45   $ 157      $ (5   $ 72,215      $ (50


Gross realized gains and losses from the sales of the Company’s marketable debt securities,
available-for-sale,
consisted of the following (in thousands):


Years Ended December 31,


2021
 
  
2020
 
  
2019
 
Gross realized gains
(1)
  
$       221      $      241      $      134  


Gross realized losses
(1)
  
$ (2    $ (49    $ (47


(1)
Recorded in other income (expense), net in the consolidated statements of net and comprehensive income. The cost basis of securities sold were determined based on the specific identification method.
The Company invests its excess cash in a diversified portfolio of fixed and variable rate debt securities to meet current and future cash flow needs. All investments are made in accordance with the Company’s approved investment policy. As of December 31, 2021, the portfolio had an average credit rating of AA and weighted term to contractual maturity of 1.5 years, with 98 securities in the portfolio with an unrealized loss aggregating $511,000, or 0.2% of amortized cost, and a weighted average credit rating of AA+.
As of December 31, 2021, the Company performed an impairment analysis and determined an allowance for credit losses was not required. The Company determined that it did not have an intent to sell and it was not more likely than not that the Company would be required to sell any security based on its current liquidity position, or to maintain compliance with its investment policy, specifically as it relates to minimum credit ratings. The Company evaluated the securities with an unrealized loss considering severity of loss, credit ratings, specific credit events during the period since acquisition, overall likelihood of default, market sector, potential impact
 
F-23

Table of Contents
MARCUS & MILLICHAP, INC.
Notes to Consolidated Financial Statements
 
from the current economic environment and a review of an issuer’s and securities’ liquidity and financial strength, as needed. The Company concluded that it would receive all scheduled interest and principal payments. The Company, therefore, determined qualitatively that the unrealized loss was related to changes in interest rates and other market factors and therefore no allowance for credit losses was required.
Amortized cost and fair value of marketable debt securities,
available-for-sale,
by contractual maturity consisted of the following (in thousands, except weighted average data):


December 31, 2021
 
  
December 31, 2020


Amortized
Cost
 
  
Fair Value
 
  
Amortized
Cost
 
  
Fair Value
 
Due in one year or less
   $ 183,915      $ 183,868      $ 158,148      $ 158,258  
Due after one year through five years
     96,035        96,257        30,604        32,041  
Due after five years through ten years
     11,129        11,601        10,022        11,044  
Due after ten years
     4,694        4,752        4,555        4,688  


     $ 295,773      $ 296,478      $ 203,329      $ 206,031  


Weighted average contractual maturity
              1.5 year                 1.6 years  
Actual maturities may differ from contractual maturities because certain issuers have the right to prepay certain obligations with or without prepayment penalties.
 
6.
Acquisitions, Goodwill and Other Intangible Assets
During the year ended December 31, 2021, the Company recorded measurement period adjustments, including additional cash expected to be received in excess of the provisional amounts that were recognized at the acquisition date for the businesses acquired during 2020. Measurement period adjustments reflect new information obtained about facts and circumstances that existed as of the acquisition dates that, if known, would have affected the measurement of the amounts recognized as of the acquisition date. The impact to amortization expense not previously recognized related to these changes in estimates was not material.
The goodwill recorded as part of the acquisitions primarily arose from the acquired assembled workforce and brokerage and financing sales platforms. The Company expects all of the goodwill to be tax deductible, with the
tax-deductible
amount of goodwill related to the contingent and deferred consideration to be determined once the cash payments are made to settle any contingent and deferred consideration. The goodwill resulting from acquisitions is allocated to the Company’s one
RU
.
Goodwill and intangible assets, net consisted of the following (in thousands):
 
    
December 31, 2021
    
December 31, 2020
 
    
Gross
Carrying
Amount
    
Accumulated
Amortization
   
Net Book
Value
    
Gross
Carrying
Amount
    
Accumulated
Amortization
   
Net Book
Value
 
Goodwill and intangible assets:
                                                   
Goodwill
   $ 34,071      $ —       $ 34,071      $ 33,375      $ —       $ 33,375  
Intangible assets
(1)(2)
     23,974        (9,940     14,034        24,745        (6,067     18,678  


     $ 58,045      $ (9,940   $ 48,105      $ 58,120      $ (6,067   $ 52,053  


(1)
Total weighted average amortization period was 5.53 years and 5.57 years as of December 31, 2021 and 2020, respectively.
 
F-24

Table of Contents
MARCUS & MILLICHAP, INC.
Notes to Consolidated Financial Statements
 
(2)
Amortization expense for the intangible assets was $3.8 million and $4.3 million for the years ended December 31, 2021 and 2020, respectively.
The changes in the carrying amount of goodwill consisted of the following (in thousands):


Years Ended
December 31,


2021
 
  
2020
 
Beginning balance
   $ 33,375      $ 15,072  
Additions from acquisitions
(1)
     696        18,303  
Impairment losses


Ending balance
   $ 34,071      $ 33,375  


(1)
 
The 2021 addition represents a measurement period adjustment.
Estimated amortization expense for intangible assets by year for the next five years and thereafter consisted of the following (in thousands):
 
    
Year Ended
December 31,
 
2022
   $ 3,474  
2023
     3,407  
2024
     2,891  
2025
     2,671  
2026
     946  
Thereafter
     645  


     $ 14,034  


The Company evaluates goodwill for impairment annually in the fourth quarter. In addition to the annual impairment evaluation, the Company evaluates at least quarterly whether events or circumstances have occurred in the period subsequent to the annual impairment testing which indicate that it is more likely than not an impairment loss has occurred. The Company evaluates its intangible assets that have finite useful lives whenever an event or change in circumstances indicates that the carrying value of the asset may not be recoverable.
 
As a result of its evaluations, the Company did not identify any situations where the recording of an impairment was required.
 
7.
Selected Balance Sheet Data
Advances and Loans, Net and Commissions Receivable, Net
Allowance for credit losses for advances and loans and commissions receivable consisted of the following (in thousands):


Advances and
Loans
 
  
Commissions
Receivable
 
  
Total
 
Beginning balance as of January 1, 2021
   $ 563      $ 94    
 
$ 657  
Credit loss expense (recovery)
     255        (89  
 
  166  
Write-offs
     (29            
 
  (29


Ending balance as of December 31, 2021
   $ 789      $ 5    
 
$ 794  


F-25

Table of Contents
MARCUS & MILLICHAP, INC
.
Notes to Consolidated Financial Statements


Advances and
Loans
 
  
Commissions
Receivable
 
 
Total
 
Beginning balance as of January 1, 2020
   $ 512      $ 32
(1)
 
  $ 544  
Credit loss expense
     126        62       188  
Write-offs
     (75               (75


Ending balance as of December 31, 2020
   $ 563      $ 94     $ 657  


(1)
Includes cumulative-effect adjustment related to the adoption of ASU
No. 2016-13,
Financial Instruments—Credit Losses.
Other Assets
Other assets consisted of the following (in thousands):


Current

December 31,
 
  
Non-Current

December 31,


2021
 
  
2020
 
  
2021
 
  
2020
 
MSRs, net of amortization
   $         $         $ 1,855      $ 1,897  
Security deposits
                         1,395        1,461  
Employee notes receivable
(1)
     40        185                  246  
Securities,
held-to-maturity
(2)
                         9,500            
Customer trust accounts and other
     5,230        4,526        396        572  


$
5,270
 
  
$
4,711
 
  
$
13,146
 
  
$
4,176


(1)
Reduction of accrued bonuses and other employee related expenses in settlement of employee notes receivable were $10 and $0 for the years ended December 31, 2021 and 2020, respectively. See Note 8 – “Related-Party Transactions” for additional information.
(2)
Securities,
held-to-maturity,
are expected to mature on September 1, 2024 and accrues interest based on the
1
-year
treasury rate.
MSRs
The net change in the carrying value of MSRs consisted of the following (in thousands):
 
    
December 31,
 
    
2021
    
2020
 
Beginning balance
   $ 1,897      $ 2,002  
Additions
     483        441  
Amortization
     (525      (546


Ending balance
   $ 1,855      $ 1,897  


The portfolio of loans serviced by the Company aggregated $1.7 billion and $1.6 billion for the periods ended December 31, 2021 and 2020, respectively. See Note 9 – “Fair Value Measurements” for additional information on MSRs.
In connection with MSR activities, the Company holds funds in escrow for the benefit of the lenders. These funds, which totaled $4.1 million and $3.2 million as of December 31, 2021 and 2020, respectively, and the offsetting obligations are not presented in the Company’s consolidated financial statements as they do not represent assets and liabilities of the Company.
 
F-26

Table of Contents
MARCUS & MILLICHAP, INC.
Notes to Consolidated Financial Statements
 
Deferred Compensation and Commissions
Deferred compensation and commissions consisted of the following (in thousands):


Current

December 31,
 
  
Non-Current

December 31,


2021
 
  
2020
 
  
2021
 
  
2020
 
SARs liability
(1)
   $
 
2,241      $ 2,162      $
 
14,918      $
 
16,671  
Commissions payable to investment sales and financing professionals
     110,769        54,082        31,697        15,306  
Deferred compensation liability
(1)
     1,080        1,519        6,921        6,768  
Other
     595        343                      


$
114,685
 
  
$
58,106
 
  
$
53,536
 
  
$
38,745


(1)
The SARs and deferred compensation liability become subject to payout as a result of a participant no longer being considered as a service provider. As a result of the retirement of certain participants, estimated amounts to be paid to the participants within the next twelve months have been classified as current.
SARs Liability
Prior to the IPO, certain employees of the Company were granted SARs under a stock-based compensation program assumed by MMC. In connection with the IPO, the SARs agreements were revised, the MMC liability of $20.0 million for the SARs was frozen as of March 31, 2013 and was transferred to MMI through a capital distribution. The SARs liability will be settled with each participant in ten annual installments in January of each year upon retirement or termination from service, or in full upon consummation of a change in control of the Company.
Under the revised agreements, MMI is required to accrue interest on the outstanding balance beginning on January 1, 2014 at a rate based on the
10-year
treasury note, plus 2%. The rate resets annually. The rates at January 1, 2021, 2020 and 2019 were 2.930%, 3.920% and 4.684% , respectively. MMI recorded interest expense related to this liability of $488,000, $710,000 and $904,000 for the years ended December 31, 2021, 2020 and 2019, respectively.
Estimated payouts within the next twelve months for participants that have separated from service have been classified as current. During the years ended December 31, 2021 and 2020, the Company made total payments of $2.2 million and $2.1 million, consisting of principal and accumulated interest, respectively.
Commissions Payable
Certain investment sales professionals have the ability to earn additional commissions after meeting certain annual revenue thresholds. These commissions are recognized as cost of services in the period in which they are earned as they relate to specific transactions closed. The Company has the ability to defer payment of certain commissions, at its election, for up to three years.
Commissions payable that are not expected to be paid within twelve months are classified as long-term.
Deferred Compensation Liability
A select group of management is eligible to participate in the Marcus & Millichap Deferred Compensation Plan (the “Deferred Compensation Plan”). The Deferred Compensation Plan is a
non-qualified
deferred
 
F-27

Table of Contents
MARCUS & MILLICHAP, INC.
Notes to Consolidated Financial Statements
 
compensation plan that is intended to comply with Section 409A of the Internal Revenue Code and permits participants to defer compensation up to the limits set forth in the Deferred Compensation Plan. Amounts are paid out generally when the participant is no longer a service provider; however, an
in-service
payout election is available to participants. Participants may elect to receive payouts as a lump sum or quarterly over a
two
to fifteen-year period. The Company elected to fund the Deferred Compensation Plan through company owned variable life insurance policies. The Deferred Compensation Plan is managed by a third-party institutional fund manager, and the deferred compensation and investment earnings are held as a Company asset in a rabbi trust, which is recorded in assets held in rabbi trust in the accompanying consolidated balance sheets. The assets in the trust are restricted unless the Company becomes insolvent, in which case the trust assets are subject to the claims of the Company’s creditors. The Company may also, in its sole and absolute discretion, elect to withdraw at any time a portion of the trust assets by an amount by which the fair market value of the trust assets exceeds 110% of the aggregate deferred compensation liability represented by the participants’ accounts. Estimated payouts within the next twelve months for participants that have separated from service or elected in service payout have been classified as current. During each of the years ended December 31, 2021 and 2020, the Company made total payments to participants of $1.5 million.
The assets held in the rabbi trust are carried at the cash surrender value of the variable life insurance policies, which represents its fair value. The net change in the carrying value of the assets held in the rabbi trust and the net change in the carrying value of the deferred compensation liability, each exclusive of additional contributions, distributions and trust expenses consisted of the following (in thousands):


Years Ended December 31,


2021
 
  
2020
 
  
2019
 
Increase in the carrying value of the assets held in the rabbi trust
(1)
   $ 1,445      $ 1,042      $ 1,353  


Increase in the net carrying value of the deferred compensation obligation
(2)
   $ 1,104      $ 799      $ 1,293  


(1)
 
Recorded in other income (expense), net in the consolidated statements of net and comprehensive income.
(2)
 
Recorded in selling, general and administrative expense in the consolidated statements of net and comprehensive income.
Other Liabilities
Other liabilities consisted of the following (in thousands):


Non-Current

December 31,


2021
 
  
2020
 
Deferred consideration
(1)(2)
   $ 4,689      $ 8,582  
Contingent consideration
(1)(2)
     6,631        4,219  
Other
     74        1,015  


     $ 11,394      $ 13,816  


(1)
The current portions of deferred consideration in the amounts of $5,112 and $6,666 as of December 31, 2021 and 2020, respectively, are included in accounts payable and other liabilities in the consolidated balance sheets. The current portions of contingent consideration in the amounts of $2,681 and $1,353 as of December 31, 2021 and 2020, respectively, are included in accounts payable and other liabilities in the consolidated balance sheets.
 
F-28

Table of Contents
MARCUS & MILLICHAP, INC.
Notes to Consolidated Financial Statements
 
(2)
Includes a measurement period adjustment and a reduction in deferred consideration settled in stock made during the year ended December 31, 2021, which represents a noncash investing activity. See Note 6 – “Acquisitions, Goodwill and Other Intangible Assets” for additional information.
 
8.
Related-Party Transactions
Shared and Transition Services
Certain services are provided to the Company under a Transition Services Agreement (“TSA”) between MMC and the Company. The TSA is intended to provide certain services until the Company acquires these services separately. Under the TSA, the Company incurred net costs (charge-back) during the years ended December 31, 2021, 2020 and 2019 of $(12,000), $68,000 and $127,000, respectively. These amounts are included in selling, general and administrative expense in the accompanying consolidated statements of net and comprehensive income.
Brokerage and Financing Services with the Subsidiaries of MMC
MMC has wholly or majority owned subsidiaries that buy and sell commercial real estate properties. The Company performs certain brokerage and financing services related to transactions of the subsidiaries of MMC. For the years ended December 31, 2021, 2020 and 2019, the Company earned real estate brokerage commissions and financing fees of $2.4 million, $2.9 million and $5.2 million, respectively, from transactions with subsidiaries of MMC related to these services. The Company incurred cost of services of $1.4 million, $1.7 million and $3.0 million, respectively, related to these revenues.
Operating Lease with MMC
The Company has an operating lease with MMC for a single-story office building located in Palo Alto, California, which expires on May 31, 2022. The related operating lease cost was $1.3 million for each of the years ended December 31, 2021, 2020 and 2019, respectively. Operating lease cost is included in selling, general and administrative expense in the accompanying consolidated statements of net and comprehensive income. See Note 4 – “Operating Leases” for additional information.
Accounts Payable and Other Liabilities with MMC
As of December 31, 2021 and 2020, accounts payable and other liabilities with MMC aggregating $93,000 and $89,000, respectively, remain unpaid and are included in accounts payable and other liabilities in the accompanying consolidated balance sheets.
Other
The Company makes advances to
non-executive
employees from
time-to-time.
At December 31, 2021 and 2020, the aggregate principal amount for employee notes receivable was $40,000 and $431,000, respectively, which is included in other assets (current and
non-current)
in the accompanying consolidated balance sheets. See Note 7 – “Selected Balance Sheet Data” for additional information.
As of December 31, 2021, George M. Marcus, the Company’s founder and Chairman, beneficially owned approximately 38% of the Company’s issued and outstanding common stock, including shares owned by Phoenix Investments Holdings, LLC and the Marcus Family Foundation II.
 
F-29

Table of Contents
MARCUS & MILLICHAP, INC.
Notes to Consolidated Financial Statements
 
9.
Fair Value Measurements
Recurring Fair Value Measurements
Assets and liabilities carried at fair value on a recurring basis consisted of the following (in thousands):
 
   
December 31, 2021
   
December 31, 2020
 
   
Fair Value
   
Level 1
   
Level 2
   
Level 3
   
Fair Value
   
Level 1
   
Level 2
   
Level 3
 
Assets:
                                                               
Assets held in rabbi trust
  $ 11,508     $        $ 11,508     $        $ 10,295     $        $ 10,295     $     


Cash equivalents
(1)
:
                                                               
Commercial paper
  $ 8,948     $        $ 8,948     $        $ 9,399     $        $ 9,399     $     
Money market funds
    210,985       210,985                         158,271       158,271                    


    $ 219,933     $ 210,985     $ 8,948     $        $ 167,670     $ 158,271     $ 9,399     $     


Marketable debt securities,
available-for-sale:
                                                               
Short-term investments:
                                                               
U.S. treasuries
  $ 35,733     $ 35,733     $        $        $ 75,970     $ 75,970     $        $     
U.S. government sponsored entities
                                        32,447                32,447           
Corporate debt
    148,135                148,135                49,841                49,841           


    $ 183,868     $ 35,733     $ 148,135     $        $ 158,258     $ 75,970     $ 82,288     $     


Long-term investments:
                                                               
U.S. treasuries
  $ 70,767     $ 70,767     $        $        $ 3,641     $ 3,641     $        $     
U.S. government sponsored entities
    745                745                1,152                1,152           
Corporate debt
    34,013                34,013                36,287                36,287           
ABS and other
    7,085                7,085                6,693                6,693           


    $ 112,610     $ 70,767     $ 41,843     $        $ 47,773     $ 3,641     $ 44,132     $     


Liabilities:
                                                               
Contingent consideration
  $ 9,312     $        $        $ 9,312     $ 5,572     $        $        $ 5,572  


Deferred consideration
  $ 9,801     $        $ 9,801     $        $ 15,248     $        $ 15,248     $     


Deferred compensation liability
  $ 8,001     $ 8,001     $        $        $ 8,287     $ 8,287     $        $     


(1)
 
Included in cash and cash equivalents on the accompanying consolidated balance sheets.
There were no transfers in or out of Level 3 during the year ended December 31, 2021.
During the year ended December 31, 2021, the Company considered the probability of achieving EBITDA and other performance targets and current and future interest rates in its determination of fair value for the contingent consideration. The Company is uncertain as to the extent of the volatility in the unobservable inputs in the foreseeable future. Deferred consideration in connection with acquisitions is carried at fair value and calculated using a discounted cash flow estimate with the only remaining condition on such payments being the passage of time.
As of December 31, 2021 and 2020, contingent and deferred consideration had a maximum undiscounted payment to be settled in cash or stock of $28.6 million and $33.2 million, respectively. Assuming the
 
F-30

Table of Contents
MARCUS & MILLICHAP, INC.
Notes to Consolidated Financial Statements
 
achievement of the applicable performance criteria and/or service and time requirements, the Company anticipates these payments will be made over the next one to five-year period. Changes in fair value are included in selling, general and administrative expense in the consolidated statements of net and comprehensive income.
A reconciliation of contingent consideration measured at fair value on a recurring basis consisted of the following (in thousands):
 
    
December 31,
 
    
2021
    
2020
 
Beginning balance
   $ 5,572      $ 3,387  
Contingent consideration in connection with acquisitions
(1)
     (100      2,918  
Change in fair value of contingent consideration
     4,659        101  
Payments of contingent consideration
     (819      (834


Ending balance
   $ 9,312      $ 5,572  


(1)
Contingent consideration in connection with acquisitions represents a noncash investing activity.
The amount recorded during the year
 ended December 31, 2021 relates to a measurement period adjustment. See Note 6 – “Acquisitions, Goodwill and Other Intangible Assets” for additional information.
Quantitative information about the valuation technique and significant unobservable inputs used in the valuation of the Company’s Level 3 financial liabilities measured at fair value on a recurring basis consisted of the following (dollars in thousands):


Fair Value at

December 31, 2021
 
 
Valuation Technique
 
 
Unobservable inputs
 
 
Range (Weighted Average)
(1)
 
Contingent consideration
  $ 9,312       Discounted cash flow       Expected life of cash flows      
1.4-5.8 years
      (3.4 years
)
 
                      Discount rate      
2.2%-3.5%
      (2.9%
)
 
                      Probability of achievement      
29.0%-100.0%
      (95.2%
)


Fair Value at

December 31, 2020
   
Valuation Technique
   
Unobservable inputs
   
Range (Weighted Average)
(1)
 
Contingent consideration
  $ 5,572       Discounted cash flow       Expected life of cash flows      
2.4-6.8
years
      (4.4 years
)

                      Discount rate      
2.6%-4.3%
      (3.4%
)
 
                      Probability of achievement      
50.0%-100.0%
      (86.1%
)
 
 
(1)
Unobservable inputs were weighted by the relative fair value of the instruments.
Nonrecurring Fair Value Measurements
MSRs are initially recorded at fair value and subsequently carried at the lower of amortized cost or fair value. The Company periodically reassesses and adjusts, when necessary, the underlying inputs and assumptions used to reflect observable market conditions and assumptions that a market participant would consider in valuing an MSR asset. Management uses assumptions in the determination of fair value for MSRs after considering default, severity, prepayment and discount rates related to the specific types and underlying collateral of the various serviced loans, interest rates, refinance rates, and current government and private sector responses on the economic impact of the
COVID-19
pandemic. The fair value of the MSRs approximated the carrying value at December 31, 2021 and 2020 after consideration of the revisions to the various assumptions. See Note 7 – “Selected Balance Sheet Data – Other Assets – MSRs” for additional information.
 
F-31

Table of Contents
MARCUS & MILLICHAP, INC.
Notes to Consolidated Financial Statements
 
Quantitative information about the valuation technique and significant unobservable inputs used in the valuation of the Company’s Level 3 financial assets measured at fair value on a nonrecurring basis consisted of the following (dollars in thousands):


Fair Value at

December 31, 2021
 
 
Valuation Technique
 
 
Unobservable inputs
 
 
Range (Weighted Average)
 (1)
 
MSRs
  $ 2,332       Discounted cash flow       Constant prepayment rates      
0.0%-20.0%
 
  
  (10.0
%
)

                      Constant default rate      
0.3%-4.9%
 
  
  (1.2
%
)

                      Loss severity      
26.2%-31.4%
 
  
  (28.0
%
)

                      Discount rate      
10.0%-10.0%
 
  
  (10.0
%
)


Fair Value at

December 31, 2020
 
 
Valuation Technique
 
 
Unobservable inputs
 
 
Range (Weighted Average)
 (1)
 
MSRs
  $ 2,135       Discounted cash flow       Constant prepayment rates      
0.0%-20.0%
   
 
  (10.0
%
)
                      Constant default rate      
0.3%-4.1%
   
 
  (1.1
%
)
                      Loss severity      
26.2%-31.4%
   
 
  (28.0
%
)
                      Discount rate      
10.0%-10.0%
   
 
  (10.0
%
)
 
(1)
Weighted average is based on the 10% constant prepayment rate scenario which the Company uses as the reported fair value.
 
10.
Stockholders’ Equity
Common Stock
As of December 31, 2021 and 2020, there were 39,692,373 and 39,401,976 shares of common stock, $0.0001 par value, issued and outstanding, which include unvested RSAs issued to
non-employee
directors, respectively. See Note 14 – “Earnings per Share” for additional information.
Preferred Stock
The Company has 25,000,000 authorized shares of preferred stock with a par value $0.0001 per share. At December 31, 2021 and 2020, there were no preferred shares issued or outstanding.
Accumulated Other Comprehensive Income/Loss
Amounts reclassified from accumulated other comprehensive income/loss are included as a component of other income (expense), net or selling, general and administrative expense, as applicable, in the consolidated statements of net and comprehensive income. The reclassifications were determined on a specific identification basis.
The Company has not provided for U.S. taxes on unremitted earnings of its foreign subsidiary as it is operating at a loss and has no earnings and profits to remit. As a result, deferred taxes were not provided related to the cumulative foreign currency translation adjustments.
 
11.
Stock-Based Compensation Plans
2013 Omnibus Equity Incentive Plan
The Company’s board of directors adopted the 2013 Plan, which became effective upon the Company’s IPO. In February 2017, the board of directors amended and restated the 2013 Plan, which was approved by the
 
F-32

Table of Contents
MARCUS & MILLICHAP, INC.
Notes to Consolidated Financial Statements
 
Company’s stockholders in May 2017. Grants are made from time to time by the compensation committee of the Company’s board of directors at its discretion, subject to certain restrictions as to the number and value of shares that may be granted to any individual. In addition,
non-employee
directors receive annual grants under a director compensation policy. At December 31, 2021, there were 4,667,141 shares available for future grants under the 2013 Plan.
Awards Granted and Settled
Under the 2013 Plan, the Company has issued RSAs to
non-employee
directors and RSUs to employees and independent contractors. RSAs vest over a
one-year
period from the date of grant subject to service requirements. RSUs generally vest in equal annual installments over a five-year period from the date of grant or earlier as approved by the compensation committee of the Company’s board of directors. Any unvested awards are canceled upon termination as a service provider. As of December 31, 2021, there were no issued or outstanding options, SARs, performance units or performance share awards under the 2013 Plan.
During the year ended December 31, 2021, 260,525 shares of RSUs vested and 60,373 shares of deferred stock units (“DSUs”) were settled and 91,457 shares of common stock were withheld to pay applicable required employee statutory withholding taxes based on the market value of the shares on the vesting date. The shares withheld for taxes were returned to the share reserve and are available for future issuance in accordance with provisions of the 2013 Plan.
 
F-33

Table of Contents
MARCUS & MILLICHAP, INC.
Notes to Consolidated Financial Statements
 
Outstanding Awards
Activity under the 2013 Plan consisted of the following (dollars in
thousands, except weighted average per share data):


RSA Grants to
Non-employee

Directors
 
 
RSU Grants to
Employees
 
 
RSU Grants to
Independent
Contractors
 
 
Total
 
 
Weighted-
Average Grant Date
Fair Value Per
Share
 
Nonvested shares at December 31, 2018
(1)
  
  27,096       471,782       392,697       891,575    
$
27.59  
Granted
  
  12,806       260,274       82,050       355,130    
$
38.51  
Vested
  
  (22,422     (186,311     (191,883     (400,616  
$
24.29  
Transferred
  
           (8,136     8,136             
$
29.68  
Forfeited/canceled
  
           (12,494     (33,520     (46,014  
$
30.65  


Nonvested shares at December 31, 2019
(1)
    17,480       525,115       257,480       800,075    
$
33.91  
Granted
    19,516       322,910       92,279       434,705    
$
32.80  
Vested
    (20,268     (170,291     (93,944     (284,503  
$
32.74  
Transferred
             (18,294     18,294             
$
33.67  
Forfeited/canceled
             (21,790     (10,108     (31,898  
$
34.49  


Nonvested shares at December 31, 2020
(1)
    16,728       637,650       264,001       918,379    
$
33.73  
Granted
    13,323       277,462       90,430       381,215    
$
39.03  
Vested
    (16,728     (172,327     (88,198     (277,253  
$
31.89  
Transferred
             (10,649     10,649             
$
34.98  
Forfeited/canceled
             (34,357     (7,048     (41,405  
$
33.47  


Nonvested shares at December 31, 2021
(1)
    13,323       697,779       269,834       980,936    
$
36.32  
Unrecognized stock-based compensation expense as of December 31, 2021
(2)
  $ 177     $ 20,389     $ 8,079     $ 28,645          


Weighted average remaining vesting period (years) as of December 31, 2021
    0.34       3.42       3.36       3.38          


(1)
Nonvested RSUs will be settled through the issuance of new shares of common stock.
(2)
 
The total unrecognized compensation expense is expected to be recognized over a weighted-average period of approximately 3.38 years.
The aggregate fair value of RSUs and RSAs that vested were $10.2 million, $8.9 million and $14.6 million for the years ended December 31, 2021, 2020 and 2019, respectively.
The fair value of fully vested DSUs that settled was $2.4 million for the year ended December 31, 2021 and $0.0 million for the each of years ended December 31, 2020 and 2019, respectively. See “SARs and DSUs” section below and Note 14 – “Earnings per Share” for additional information.
On February 16, 2022, the Board of Directors declared a semi-annual regular dividend of $0.25
per share
and a special dividend of $1.00 per share, payable on April 4, 2022, to s
tock
holders of record at the close of
 
F-34

Table of Contents
MARCUS & MILLICHAP, INC.
Notes to Consolidated Financial Statements
 
business on March 8, 2022. Dividend equivalents totaling $2.5 million
will
 be paid on unvested restricted stock and deferred stock units granted under the 2013 Plan
;
 however, these amounts will be paid when the underlying restricted stock and deferred stock units vest.
ESPP
In 2013, the Company adopted the ESPP. The ESPP is intended to qualify under Section 423 of the Internal Revenue Code and provides for consecutive,
non-overlapping
6-month
offering periods.
The offering periods generally start on the first trading day on or after May 15 and
November 15 of each year.
Qualifying employees may purchase shares of the Company stock at a 10% discount based on the lower of the market price
at the beginning or end of the offering period, subject to IRS limitations. The Company determined that the ESPP was a compensatory plan and is required to expense the fair value of the awards over each
6-month
offering period.
The ESPP initially had 366,667 shares of common stock reserved, and 156,725 shares of common stock remain available for issuance as of December 31, 2021. The ESPP provides for annual increases in the number of shares available for issuance under the ESPP, equal to the least of (i) 366,667 shares, (ii) 1% of the outstanding shares on such date, or (iii) an amount determined by the compensation committee of the board of directors. Pursuant to the provisions of the ESPP, the board of directors has determined to not provide for any annual increases to date. At December 31, 2021, total unrecognized compensation cost related to the ESPP was $83,000 and is expected to be recognized over a weighted average period of 0.37 years.
SARs and DSUs
Prior to the IPO, certain employees were granted SARs. As of March 31, 2013, the outstanding SARs were frozen at the liability amount, and will be paid out to each participant in installments upon retirement or departure under the terms of the revised SARs agreements. To replace beneficial ownership in the SARs, the difference between the book value liability and the fair value of the awards was granted to plan participants in the form of DSUs, which were fully vested upon receipt and will be settled in actual stock at a rate of 20% per year if the participant remains employed by the Company during that period (otherwise all unsettled shares of stock upon termination from service will be settled five years from the termination date, unless otherwise agreed to by the Company). In the event of death or termination of service after reaching the age of 67, 100% of the DSUs will be settled. As of December 31, 2021, 281,193 shares of fully vested DSUs remained to be settled in 2022.
Summary of Stock-Based Compensation
Components of stock-based compensation are included in selling, general and administrative expense in the consolidated statements of net and comprehensive income and consisted of the following (in thousands):


Years Ended December 31,


2021
 
  
2020
 
  
2019
 
ESPP
  
$

142     
$

168     
$

139  
RSAs –
non-employee
directors
  
 
463     
 
606     
 
643  
RSUs – employees
(1)
  
 
6,642     
 
6,003     
 
5,419  
RSUs – independent contractors
  
 
3,114     
 
3,128     
 
3,077  


$
10,361     
$

9,905     
$
9,278  


(1)
Years ended December 31, 2020 and 2019 include expenses related to the acceleration of vesting of certain RSUs.
 
F-35

Table of Contents
MARCUS & MILLICHAP, INC.
Notes to Consolidated Financial Statements
 
12.
Income Taxes
The components of income from continuing operations before provision for income taxes consisted of the following (in thousands):


Years Ended December 31,


2021
 
  
2020
 
  
2019
 
United States
 
$

193,147    
$

62,206    
$

112,425  
Foreign
 
 
156    
 
(2,842  
 
(4,913


$

193,303    
$

59,364    
$
107,512  


The provision for income taxes consisted of the following (in thousands):
 
    
Years Ended December 31,
 
    
2021
    
2020
    
2019
 
Federal:
                          
Current
   $ 48,785      $ 12,437      $ 22,638  
Deferred
     (9,600      310        665  


       39,185        12,747        23,303  


State:
                          
Current
     13,903        3,616        7,718  
Deferred
     (2,243      163        (507


       11,660        3,779        7,211  


Foreign:
                          
Current
                             
Deferred
     (12                68  


       (12                68  


     $ 50,833      $ 16,526      $ 30,582  


F-36

Table of Contents
MARCUS & MILLICHAP, INC.
Notes to Consolidated Financial Statements
 
Significant components of the Company’s deferred tax assets, net consisted of the following (in thousands):
 
    
December 31,
 
    
2021
    
2020
 
Deferred Tax Assets:
                 
Accrued expenses and bonuses
   $ 6,822      $ 3,078  
Bad debt and other reserves
     6,989        4,889  
Deferred compensation
     18,287        12,536  
Operating lease ROU assets, net
     20,937        21,125  
Stock-based compensation
     7,031        7,403  
Net operating and capital loss carryforwards
     3,769        3,932  
State taxes
     92        (163
Amortizable intangibles and other
     1,577        1,070  


Deferred tax assets before valuation allowance
     65,504        53,870  
Valuation allowance
     (4,599      (4,418


Deferred Tax Assets
     60,905        49,452  


Deferred Tax Liabilities:
                 
Fixed assets
     (6,552      (6,814
Operating lease liabilities
     (18,697      (19,357
Prepaid expenses
     (1,513      (533
Other comprehensive income
     (195      (800
Goodwill and other
     (212      (574


Deferred Tax Liabilities
     (27,169      (28,078


Deferred Tax Assets, Net
   $ 33,736      $ 21,374  


As of December 31, 2021, and 2020, the Company had state and Canadian net operating loss carryforwards of approximately $14.7 million and $15.4 million, respectively, principally all of which will begin to expire in 2033.
A valuation allowance is required when it is more-likely-than not that all or a portion of a deferred tax asset will not be realized. Realization of a deferred tax asset is dependent upon taxable income in prior carryback years, estimates of future taxable income, tax planning strategies and reversals of existing taxable temporary differences. The Company determined that as of December 31, 2021 and 2020, $4.6 million and $4.4 million, respectively, of the deferred tax assets related to state and Canadian losses do not satisfy the recognition criteria. The Company has therefore recorded a valuation allowance for this amount. The valuation allowance for deferred tax assets was increased by $179,000, $497,000 and $1.4 million during 2021, 2020 and 2019, respectively. The increases are primarily related to the Company’s Canadian operations.
 
F-37

Table of Contents
MARCUS & MILLICHAP, INC.
Notes to Consolidated Financial Statements
 
The provision for income taxes differs from the amount computed by applying the statutory federal corporate income tax rate to income before provision for income taxes and consisted of the following (dollars in thousands):


Years Ended December 31,


2021
 
 
2020
 
 
2019


Amount
 
 
Rate
 
 
Amount
 
 
Rate
 
 
Amount
 
 
Rate
 
Income tax expense at the federal statutory rate
  $
40,594
      21.0   $ 12,466       21.0   $ 22,578       21.0
State income tax expense, net of federal benefit
    9,210       4.8     2,983       5.0     5,698       5.3
(Windfall) shortfall tax benefits, net related to stock-based compensation
    (555     (0.3 )%      240       0.4     (196     (0.2 )% 
Change in valuation allowance
    179       0.1     497       0.8     1,351       1.3
Permanent and other items
(1)
    1,405       0.7     340       0.6     1,151       1.0


    $ 50,833       26.3   $ 16,526       27.8   $ 30,582       28.4


(1)
 
Permanent items relate principally to compensation charges, qualified transportation fringe benefits, reversal of uncertain tax positions and meals and entertainment.
A reconciliation of the beginning and ending amounts of unrecognized tax benefits consisted of the following (in thousands):


Years Ended December 31,


2021
 
  
2020
 
  
2019
 
Beginning balance
   $ 55    
 
$ 775    
 
$
1,246
 
Gross increase as a result of positions taken:
                        
Prior periods
     1                    
Current period
     304                    
Settlement with tax authorities
                           
Expiration of applicable statutes of limitation
     (56     (720     (471


Ending balance
  
$
304
    $ 55     $ 775  


Unrecognized tax benefits balance decreased by $56,000 due to the expiration of the statute of limitations and increased by $304,000 due to the tax positions in the current period. Of the total amount of unrecognized tax benefit, if recognized, $0 would affect the effective tax rate. During the years ended December 31, 2021 and 2020, penalties of $0 and $13,000 respectively, were recorded relating to unrecognized tax benefits.
The Company is subject to tax in various jurisdictions and, as a matter of ordinary course, the Company may be subject to income tax examinations by the federal, state and foreign taxing authorities for the tax years 2017 to 2021. The Company is currently under income tax examination by the state of New York.
The Company has not provided for U.S. taxes on unremitted earnings of its foreign subsidiary as this subsidiary is operating at a loss and has no earnings and profits to remit. As a result, deferred taxes were not provided related to the cumulative translation adjustments.

 
13.
Retirement Plans
The Company has its own defined contribution plan (the “Marcus & Millichap, Inc. 401(k) Plan”) under Section 401(k) of the Internal Revenue Code for all eligible employees who
have completed one month of
 

F-38

Table of Contents
MARCUS & MILLICHAP, INC
.
Notes to Consolidated Financial Statements
 
service.
 
The contribution plan is subject to the provisions of the Employee Retirement Income Security Act of 1974 (“ERISA”), as amended. Participants may contribute up to
100
% of their annual eligible compensation, subject to IRS limitations and ERISA. The Company matches employees’ contributions each pay period, dollar for dollar, up to a maximum of $
4,000
. Employees become vested in these Company contributions
33
% upon one year of service,
66
% upon two years of service and
100
% upon three years of service. Company matching contributions aggregated $
1.2
 million, $
1.0
 million and $
1.1
 million for the years ended December 31, 2021, 2020 and 2019, respectively, which is included in selling, general and administrative expense in the consolidated statements of net and comprehensive income.
 
14.
Earnings per Share
Basic and diluted earnings per share for the years ended December 31, 2021, 2020 and 2019 consisted of the following (in thousands, except per share data):


Years Ended December 31,


2021
 
 
2020
 
 
2019
 
Numerator (Basic and Diluted):


Net income
   $ 142,470      $ 42,838      $ 76,930  
Change in value for stock settled consideration
     27        3            


Adjusted net income
   $ 142,497      $ 42,835      $ 76,930  


Denominator:
                          
Basic
                          
Weighted Average Common Shares Issued and Outstanding
     39,575        39,318        39,083  
Deduct: Unvested RSAs
(1)
     (14      (18      (21
Add: Fully vested DSUs
(2)
     327        342        342  


Weighted Average Common Shares Outstanding
     39,888        39,642        39,404  


Basic earnings per common share
   $ 3.57      $ 1.08      $ 1.95  


Diluted
                          
Weighted Average Common Shares Outstanding from above
     39,888        39,642        39,404  
Add: Dilutive effect of RSUs, RSAs & ESPP
     206        67        144  
Add: Contingently issuable shares
(3)
     93        26            


Weighted Average Common Shares Outstanding
     40,187        39,735        39,548  


Diluted earnings per common share
   $ 3.55      $ 1.08      $ 1.95  


Antidilutive shares excluded from diluted earnings per common share
(4)
     366        684        348  


(1)
RSAs were issued and outstanding to the
non-employee
directors and have a
one
-year
vesting term subject to service requirements. See Note 11 – “Stock-Based Compensation Plans” for additional information.
(2)
Shares are included in weighted average common shares outstanding as the shares are fully vested but have not yet been delivered. See Note 11 – “Stock-Based Compensation Plans” for additional information. 
(3)
Relates to contingently issuable stock settled consideration.
(4)
Primarily pertaining to RSU grants to the Company’s employees and independent contractors.
 
F-39

Table of Contents
MARCUS & MILLICHAP, INC
.
Notes to Consolidated Financial Statements
 

15.
Commitments and Contingencies
Credit Agreement
On June 18, 2014, the Company entered into a Credit Agreement with Wells Fargo Bank, National Association (the “Bank”), as amended and restated on May 28, 2019, and further, amended on November 27, 2019 and on February 9, 2021 (the “Credit Agreement”). The Credit Agreement provides for a $60.0 million principal amount senior secured revolving credit facility that is guaranteed by all of the Company’s domestic subsidiaries (the “Credit Facility”) and matures on June 1, 2022. The Company may borrow, repay and reborrow amounts under the Credit Facility until its maturity date, at which time all amounts outstanding under the Credit Facility must be repaid in full. Upon the expiration of the use of the LIBOR as a benchmark, the benchmark will be replaced with the SOFR plus a spread adjustment.
Borrowings under the Credit Agreement are available for general corporate purposes and working capital. The Credit Facility includes a
$10.0 million sublimit for the issuance of standby letters of credit of which $533,000 was utilized at December 31, 2021. Borrowings under the Credit
Facility will bear interest, at the Company’s option, at either (i) a fluctuating rate per annum 2.00% below the Base Rate (defined as the highest of
(a) the Bank’s prime rate,
(b) one-month
LIBOR plus 1.50%, and (c) the federal funds rate plus 1.50%), or (ii) at a fixed rate per annum determined by
Bank to be between 0.875% to 1.125% above LIBOR.
In connection with the amendments of the Credit Agreement, the Company paid bank fees and other expenses, which are being amortized over the remaining term of the Credit Agreement. The Company pays a commitment fee of up to 0.1% per annum, payable quarterly, based on the amount of unutilized commitments under the Credit Facility. The amortization and commitment fee is included
in interest expense in the accompanying consolidated statements of net and comprehensive income and was $87,000, $93,000 and $94,000 during the years ended December 31, 2021, 2020 and 2019, respectively. As of December 31, 2021, there were no amounts outstanding under the Credit
Agreement.
The Credit Facility contains customary covenants, including financial and other covenant reporting requirements and events of default. Financial covenants require the Company, on a combined basis with its guarantors, to maintain (i) an EBITDAR Coverage Ratio (as defined in the Credit Agreement) of not less than 1.25:1.0 as of each quarter end, determined on a rolling four-quarter basis, and (ii) total funded debt to EBITDA not greater than 1.5:1.0 as of each quarter end, determined on a rolling four-quarter basis, and also limits investments in foreign entities and certain other loans. The Credit Facility is secured by substantially all assets of the Company, including pledges of 100% of the stock or other equity interest of each subsidiary except for the capital stock of a controlled foreign corporation (as defined in the Internal Revenue Code), in which case no such pledge is required. As of December 31, 2021, the Company was in compliance with all financial and
non-financial
covenants and has not experienced any limitation in its operations as a result of the covenants.
Strategic Alliance
The Company, in connection with the strategic alliance with M&T Realty Capital Corporation (“M&T Realty Capital”), has agreed to provide loan opportunities that may be funded through M&T Realty Capital’s Delegated Underwriting and Servicing Agreement with Fannie Mae. M&T Realty Capital’s agreement with Federal National Mortgage Association (“Fannie Mae”) requires M&T Realty Capital to guarantee a portion of each funded loan. On a
loan-by-loan
basis, the Company, at its option, can agree to assume a portion of M&T Realty’s guarantee obligation of loan opportunities presented to and closed by M&T Realty Capital. As of December 31, 2021, the Company has not agreed to any guarantee obligations for loan opportunities presented to M&T Realty Capital.
 
F-40

Table of Contents
MARCUS & MILLICHAP, INC.
Notes to Consolidated Financial Statements
 
Other

In connection with certain agreements with investment sales and financing professionals, the Company may agree to advance amounts to such professionals upon reaching certain time and performance goals. Such commitments as of December 31, 2021 aggregated $18.2 million.
 
16.
Subsequent Events
In connection with agreements in principle with investment sales and financing professionals and business acquisitions, the Company entered into commitments through the date these consolidated financial statements were issued, aggregating $38.1 million, of which $29.2 million has been paid. Such commitments to investment sales and financing professionals may be subject to various conditions.
On February 16, 2022, the Board of Directors declared a semi-annual regular dividend of $0.25
per share
and a special dividend of $1.00 per share, payable on April 4, 2022, to
stockho
lders of record at the close of business on March 8, 2022. Based on the estimated number of shares to be outstanding as of March 8, 2022,
the
dividend
s
declared aggregated $52.1 million, including dividend equivalents totaling $2.5 million to be paid on unvested restricted stock and deferred stock units granted under the 2013 Plan
.
 
These dividend equivalents
 will be paid when the underlying restricted stock and deferred stock units vest. Any and all future dividends are subject to review and approval by the Board of Directors.
 

F-41