SPECIAL NOTE REGARDING FORWARD-LOOKING STATEMENTS
This Annual Report on Form
10-K
includes forward-looking statements, including the Company’s business outlook for 2020 and expectations for changes (or fluctuations) in market share growth. We have based these forward-looking statements largely on our current expectations and projections about future events and financial trends affecting the financial condition of our business. Forward-looking statements should not be read as a guarantee of future performance or results and will not necessarily be accurate indications of the times at, or by, which such performance or results may be achieved. Forward-looking statements are based on information available at the time those statements are made and/or management’s good faith belief as of that time with respect to future events and are subject to risks and uncertainties that could cause actual performance or results to differ materially from those expressed in or suggested by the forward-looking statements. Important factors that could cause such differences include, but are not limited to:| • | market trends in the commercial real estate market or the general economy; |
| • | our ability to attract and retain qualified senior executives, managers and investment sales and financing professionals; |
| • | the effects of increased competition on our business; |
| • | our ability to successfully enter new markets or increase our market share; |
| • | our ability to successfully expand our services and businesses and to manage any such expansions; |
| • | our ability to retain existing clients and develop new clients; |
| • | our ability to keep pace with changes in technology; |
| • | any business interruption or technology failure and any related impact on our reputation; |
| • | changes in interest rates, tax laws, employment laws or other government regulation affecting our business; and |
| • | other risk factors included under “Risk Factors” in this Annual Report on Form 10-K. |
In addition, in this Annual Report, the words “believe,” “may,” “will,” “estimate,” “continue,” “anticipate,” “intend,” “expect,” “predict,” “potential”, “should” and similar expressions, as they relate to our company, our business and our management, are intended to identify forward-looking statements. In light of these risks and uncertainties, the forward-looking events and circumstances discussed in this Annual Report on Form
10-K
may not occur and actual results could differ materially from those anticipated or implied in the forward-looking statements.Forward-looking statements speak only as of the date of this Annual Report on Form
10-K.
You should not put undue reliance on any forward-looking statements. We assume no obligation to update forward-looking statements to reflect actual results, changes in assumptions or changes in other factors affecting forward-looking information, except to the extent required by applicable laws. If we update one or more forward-looking statements, no inference should be drawn that we will make additional updates with respect to those or other forward-looking statements.3
PART I
Unless the context requires otherwise, the words “Marcus & Millichap,” “Marcus & Millichap Real Estate Investment Services,” “MMREIS,” “MMI,” “we,” the “Company,” “us” and “our” refer to Marcus & Millichap, Inc., Marcus & Millichap Real Estate Investment Services, Inc. and its other consolidated subsidiaries.
Item 1. Business
Company Overview
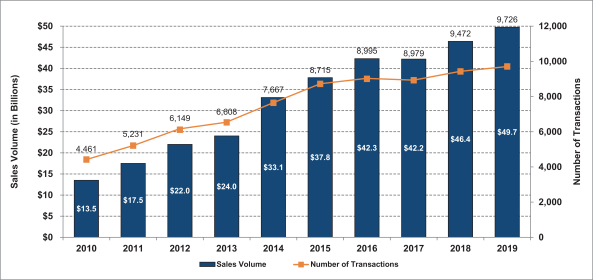
Marcus & Millichap, Inc. (“MMI”) is a leading national real estate services firm specializing in commercial real estate investment sales, financing, research and advisory services. We are the leading national investment brokerage company in the
$1-$10
million private client market segment. This is the largest and most active market segment and comprised approximately 84% of total U.S. commercial property transactions greater than $1 million in the marketplace in 2019. As of December 31, 2019, we had 2,021 investment sales and financing professionals that are primarily exclusive commission based independent contractors who provide real estate investment brokerage and financing services to sellers and buyers of commercial real estate in 82 offices in the United States and Canada. In 2019, we closed 9,726 sales, financing and other transactions with total sales volume of approximately $49.7 billion.We service clients by underwriting, marketing, selling and financing commercial real estate properties in a manner that maximizes value for sellers, provides buyers with the largest and most diverse inventory of commercial properties and secures the most competitive financing from lenders for borrowers. Our business model is based on several key attributes:
| • | a 49-year history of providing investment brokerage and financing services through proprietary inventory and marketing systems, policies and culture of information sharing and in-depth investment brokerage training. These services are executed by our salesforce under the supervision of a dedicated management team focused on client service and growing the firm; |
| • | market leading share and brand within the $1-$10 million private client market segment, which consistently represents more than 80% of total U.S. commercial property transactions greater than $1 million in the marketplace; |
| • | investment sales and financing professionals providing exclusive client representation across multiple property types; |
| • | a broad geographic platform in the United States and Canada powered by information sharing and proprietary real estate marketing technologies; |
| • | an ability to scale with our private clients as they grow and connect private capital with larger assets through our Institutional Property Advisors (“IPA”) group; |
| • | a financing team integrated with our brokerage sales force providing independent mortgage brokerage services by accessing a wide range of lenders on behalf of our clients; |
| • | an experienced management team overseeing our offices, with an average of 11 years of real estate investment brokerage experience with our Company; |
| • | our managers are in a support and leadership role as company executives and do not compete with or participate in investment sales professionals’ commissions; and |
| • | industry-leading research and advisory services tailored to the needs of our clients and supporting our investment sales and financing professionals. |
4
Corporate Information
We were formed as a sole proprietorship in 1971, incorporated in California on August 26, 1976 as G. M. Marcus & Company, and we were renamed as Marcus & Millichap, Inc. in August 1978, Marcus & Millichap Real Estate Investment Brokerage Company in September 1985, and Marcus & Millichap Real Estate Investment Services, Inc., (“MMREIS”), in February 2007. Prior to the completion of our initial public offering (“IPO”), MMREIS was majority-owned by Marcus & Millichap Company (“MMC”) and all of MMREIS’ preferred and common stock outstanding was held by MMC and its affiliates or officers and employees of MMREIS. In June 2013, in preparation for the
spin-off
of its real estate investment services business, MMC formed a Delaware holding company called Marcus & Millichap, Inc., or MMI. Prior to the completion of our IPO, the shareholders of MMREIS contributed the shares of MMREIS to MMI in exchange for common stock of MMI, and MMREIS became a wholly-owned subsidiary of MMI. On November 5, 2013, MMI completed its IPO.Our principal executive offices are located at 23975 Park Sorrento, Suite 400 Calabasas, California 91302. Our telephone number at this location is (818)
212-2250.
Our website address is www.MarcusMillichap.com. The information on our website is not part of, and is not incorporated into, this Annual Report on Form 10-K.
Our Services
We generate revenues by collecting real estate brokerage commissions upon the sale, and fees upon the financing, of commercial properties, and by providing consulting and advisory services. Real estate brokerage commissions are typically based upon the value of the property and financing fees are typically based upon the size of the loan. In 2019, approximately 91% of our revenues were generated from real estate brokerage commissions, 8% from financing fees and 1% from other revenues, including consulting and advisory services.
We divide commercial real estate into four major market segments, characterized by price in order to understand trends in our revenue from period to period:
| • | Properties priced less than $1 million; |
| • | Private client market: |
| • | Middle market: |
| • | Larger transaction market: |
We serve clients with one property, multiple properties and large investment portfolios. The largest group of investors we serve typically transacts in the
$1-$10
million private client market segment. The investment brokerage and financing businesses serving private clients within the private client market segment represent the largest part of our business, which differentiates us from our competitors. In 2019, approximately 67% of our brokerage commissions came from this market segment. Properties in this market segment are characterized by higher asset turnover rates due to the type of investor as compared to other market segments. Private clients are often motivated to buy, sell and/or refinance properties not only for business reasons but also due to personal circumstances, such as death, divorce, changes in partnership structures and other personal or financial circumstances. Therefore, private client investors are influenced less by the macroeconomic trends than other large-scale investors, making the private client market segment less volatile over the long-term than other market segments. Accordingly, our business model distinguishes us from our national competitors, who may focus primarily on the more volatile larger transaction and middle market segments, or on other business activities such as leasing or property management, and from our local and regional competitors, who lack a broad national platform.Geographic Locations
We were founded in 1971 in the western United States, and we continue to increase our presence throughout North America through execution of our growth strategies by targeting markets based on population, employment,
5
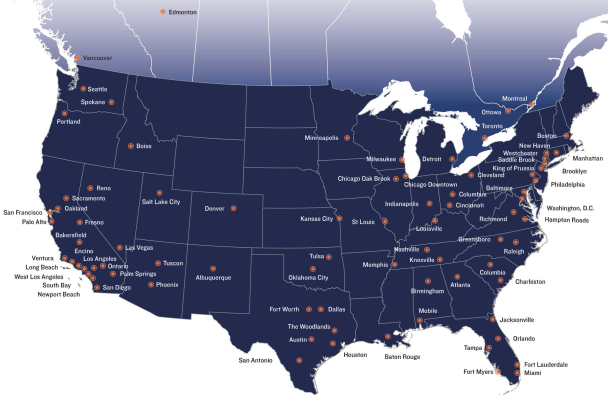
level of commercial real estate sales, inventory and competitive landscape opportunities where we believe the markets will benefit from our business model. We have grown to have offices in 34 states across the United States and in 4 provinces in Canada. In 2018 and 2019, we completed acquisitions that expanded our presence in the financing market in the Midwest and in the real estate brokerage market in Canada. In 2018, we also added commercial mortgage servicing to our financing services.
Below is a map reflecting the geographic location of our 82 offices as of December 31, 2019.
Commercial Real Estate Investment Brokerage
Our primary business and source of revenue is the representation of commercial property owners as their exclusive investment broker in the sale of their properties. Our investment sales professionals also represent buyers in fulfilling their investment real estate acquisition needs. Commissions from real estate investment brokerage sales accounted for approximately 91% of our revenues in 2019. Sales are generated by maintaining relationships with property owners, providing market information and trends to them during their investment or “hold” period and being selected as their representative when they decide to sell, buy additional property or exchange their property for another property. We collect commissions upon the sale of each property based on a percentage of sales price. These commission percentages are typically inversely correlated with sales price and thus are generally higher for smaller transactions.
We underwrite, value, position and market properties to reach the largest and most qualified pool of buyers. We offer our clients the industry’s largest team of investment sales professionals, who operate with a culture and policy of information sharing powered by our proprietary system, MNet, which enables real-time buyer-seller matching. We use a proactive marketing campaign that leverages the investor relationships of our entire sales force, direct marketing and a suite of proprietary
web-based
tools that connects each asset with the right buyer pool. We strive to maximize value for the seller by generating high demand for each property. Our approach also6