UNITED STATES
SECURITIES AND EXCHANGE COMMISSION
Washington, D.C. 20549
FORM 10-K
(Mark One)
| ☒ | ANNUAL REPORT PURSUANT TO SECTION 13 OR 15(d) OF THE SECURITIES EXCHANGE ACT OF 1934 |
For the fiscal year ended December 31, 2016
OR
| ☐ | TRANSITION REPORT PURSUANT TO SECTION 13 OR 15(d) OF THE SECURITIES EXCHANGE ACT OF 1934 |
For the transition period from to .
Commission File Number 001-36155
MARCUS & MILLICHAP, INC.
(Exact name of registrant as specified in its charter)
| Delaware | 35-2478370 | |
| (State or other jurisdiction of incorporation or organization) |
(I.R.S. Employer Identification No.) |
23975 Park Sorrento, Suite 400 Calabasas, California, 91302
(Address of principal executive offices, including zip code)
Registrant’s telephone number, including area code: (818) 212-2250
Securities registered pursuant to Section 12(b) of the Act:
| Title of Each Class |
Name of Each Exchange on Which Registered | |
| Common Stock, par value $0.0001 per share | New York Stock Exchange |
Securities registered pursuant to Section 12(g) of the Act: None
Indicate by check mark if the registrant is a well-known seasoned issuer, as defined in Rule 405 of the Securities Act. Yes ☐ No ☒
Indicate by check mark if the registrant is not
required to file reports pursuant to Section 13 or Section 15(d) of the Exchange Act.
Yes ☐ No ☒
Indicate by check mark whether the registrant (1) has filed all reports required to be filed by Section 13 or 15(d) of the Securities Exchange Act of 1934 during the preceding 12 months (or for such shorter period that the registrant was required to file such reports), and (2) has been subject to such filing requirements for the past 90 days. Yes ☒ No ☐
Indicate by check mark whether the Registrant has submitted electronically and posted on its corporate Web site, if any, every Interactive Data File required to be submitted and posted pursuant to Rule 405 of Regulation S-T (§ 232.405 of this chapter) during the preceding 12 months (or for such shorter period that the Registrant was required to submit and post such files). Yes ☒ No ☐
Indicate by check mark if disclosure of delinquent filers pursuant to Item 405 of Regulation S-K (§ 229.405 of this chapter) is not contained herein, and will not be contained, to the best of registrant’s knowledge, in definitive proxy or information statements incorporated by reference in Part III of this Form 10-K or any amendment to this Form 10-K. ☐
Indicate by check mark whether the registrant is a large accelerated filer, an accelerated filer, a non-accelerated filer, or a smaller reporting company. See the definitions of “large accelerated filer,” “accelerated filer,” and “smaller reporting company” in Rule 12b-2 of the Exchange Act.
| Large accelerated filer | ☐ | Accelerated filer | ☒ | |||
| Non-accelerated filer | ☐ (Do not check if a smaller reporting company) | Smaller reporting company | ☐ | |||
Indicate by check mark whether the registrant is a shell company (as defined in Rule 12b-2 of the Act). Yes ☐ No ☒
The aggregate market value of the registrant’s voting stock held by non-affiliates at June 30, 2016 was approximately $402.6 million, based on the closing price per share of common stock on that date of $25.41 as reported on the New York Stock Exchange. Shares of common stock known by the registrant to be beneficially owned by directors and executive officers of the registrant and 10% stockholders are not included in the computation. The registrant, however, has made no determination that such persons are “affiliates” within the meaning of Rule 12b-2 under the Securities Exchange Act of 1934.
As of March 2, 2017, there were 38,071,772 shares of the registrant’s common stock outstanding.
DOCUMENTS INCORPORATED BY REFERENCE
Portions of the registrant’s Proxy Statement to be delivered to stockholders in connection with the annual meeting of stockholders to be held on May 4, 2017 are incorporated by reference into Part III of this Annual Report on Form 10-K. Such Proxy Statement will be filed with the United States Securities and Exchange Commission (the “SEC”) within 120 days of the registrant’s fiscal year ended December 31, 2016.
MARKET, INDUSTRY AND OTHER DATA
Unless otherwise indicated, information contained in this Annual Report on Form 10-K concerning the commercial real estate industry and the markets in which we operate, including our general expectations and market position, market opportunity and market size, is based on (i) information gathered from various sources, (ii) certain assumptions that we have made, and (iii) on our knowledge of the commercial real estate market. While we believe our market position, market opportunity and market size information included in this Annual Report on Form 10-K are generally reliable, such information is inherently imprecise. Unless indicated otherwise, the industry data included herein is generally based on information available through the nine months ended September 30, 2016 since full year 2016 information may not yet have been published. We use market data from Costar Group, Inc. and Real Capital Analytics that consists of list side information of sales transactions, with a value of $1 million or more, of multifamily, retail, office and industrial buildings.
2
SPECIAL NOTE REGARDING FORWARD-LOOKING STATEMENTS
This Annual Report on Form 10-K includes forward-looking statements. We have based these forward-looking statements largely on our current expectations and projections about future events and financial trends affecting the financial condition of our business. Forward-looking statements should not be read as a guarantee of future performance or results, and will not necessarily be accurate indications of the times at, or by, which such performance or results will be achieved. Forward-looking statements are based on information available at the time those statements are made and/or management’s good faith belief as of that time with respect to future events, and are subject to risks and uncertainties that could cause actual performance or results to differ materially from those expressed in or suggested by the forward-looking statements. Important factors that could cause such differences include, but are not limited to:
| • | market trends in the commercial real estate market or the general economy; |
| • | our ability to attract and retain qualified managers, investment sales and financing professionals; |
| • | the effects of increased competition on our business; |
| • | our ability to successfully enter new markets or increase our market share; |
| • | our ability to successfully expand our services and businesses and to manage any such expansions; |
| • | our ability to retain existing clients and develop new clients; |
| • | our ability to keep pace with changes in technology; |
| • | any business interruption or technology failure and any related impact on our reputation; |
| • | changes in tax laws, employment laws or other government regulation affecting our business; and |
| • | other risk factors included under “Risk Factors” in this Annual Report on Form 10-K. |
In addition, in this Annual Report, the words “believe,” “may,” “will,” “estimate,” “continue,” “anticipate,” “intend,” “expect,” “predict,” “potential” and similar expressions, as they relate to our company, our business and our management, are intended to identify forward-looking statements. In light of these risks and uncertainties, the forward-looking events and circumstances discussed in this Annual Report on Form 10-K may not occur and actual results could differ materially from those anticipated or implied in the forward-looking statements.
Forward-looking statements speak only as of the date of this Annual Report on Form 10-K. You should not put undue reliance on any forward-looking statements. We assume no obligation to update forward-looking statements to reflect actual results, changes in assumptions or changes in other factors affecting forward-looking information, except to the extent required by applicable laws. If we update one or more forward-looking statements, no inference should be drawn that we will make additional updates with respect to those or other forward-looking statements.
3
Unless the context requires otherwise, the words “Marcus & Millichap,” “Marcus & Millichap Real Estate Investment Services,” “MMREIS,” “we,” the “Company,” “us” and “our” refer to Marcus & Millichap, Inc., Marcus & Millichap Real Estate Investment Services, Inc. and its other consolidated subsidiaries.
Overview
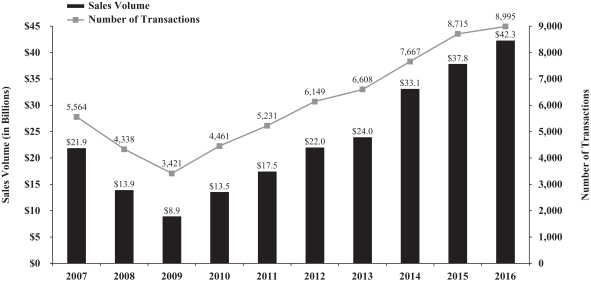
Marcus & Millichap, Inc. (“MMI”) is a leading national brokerage firm specializing in commercial real estate investment sales, financing, research and advisory services. We have been the top broker in the United States based on the number of investment transactions over the last 10 years. As of December 31, 2016, we had over 1,700 investment sales and financing professionals in 82 offices in the United States and Canada that provide investment brokerage and financing services to sellers and buyers of commercial real estate. In 2016, we closed 8,995 sales, financing and other transactions with total sales volume of approximately $42.3 billion.
We divide commercial real estate into four major market segments, characterized by price:
| • | Properties with prices less than $1 million; |
| • | Private client market: properties priced from $1 million up to $10 million; |
| • | Middle market: properties priced from $10 million up to $20 million; and |
| • | Larger transaction market: properties priced from $20 million and above. |
We service clients in all of these market segments by underwriting, marketing and selling commercial real estate properties in a manner that maximizes value for sellers and provides buyers with the largest and most diverse inventory of commercial properties. Our business model is based on several key attributes:
| • | a 46-year history of providing investment brokerage and financing services through a proprietary marketing system, policies and culture of information sharing and in-depth investment brokerage training, all of which is executed under the supervision of a dedicated management team focused on client service and growing the firm; |
| • | market leading share and brand within the $1-$10 million private client market segment, which consistently represents more than 80% of total U.S. commercial property transactions greater than $1 million in the marketplace; |
| • | Over 1,700 investment sales and financing professionals providing consistent services and exclusive client representation across multiple property types; |
| • | a broad geographic platform consisting of 82 offices in the United States and Canada powered by information sharing and proprietary real estate marketing technologies; |
| • | an ability to scale with our private clients as they grow and connect private capital with larger assets through our Institutional Property Advisors (“IPA”) group; |
| • | a financing team integrated with our brokerage salesforce providing independent mortgage brokerage services; |
| • | an experienced management team overseeing our offices, with an average of approximately 10 years of real estate investment brokerage experience with our Company; our managers do not compete with or participate in investment sales professionals’ commissions; they are in a support and leadership role as company executives; and |
| • | industry-leading research and advisory services tailored to the needs of our clients and supporting our investment sales and financing professionals. |
4
The investment brokerage and financing businesses serving private clients within the $1-$10 million private client market segment represent the largest part of our business, which differentiates us from our competitors. In 2016, approximately 68% of our brokerage commissions came from this market segment. Accordingly, our business model distinguishes us from our national competitors, who may focus primarily on the more volatile larger transaction market segment or on other business activities such as leasing or property management, and from our local and regional competitors, who lack a broad national platform.
Our business model and geographic footprint provide an unparalleled level of connectivity to the marketplace for our clients. Our investment sales and financing professionals are specialized by property type and by local market area, as we believe this focused expertise brings value to our clients. Our broad geographic coverage, encompassing 82 offices in the United States and Canada, combined with our local and national property expertise and significant relationships with both buyers and sellers, provides exposure and access to properties across the United States and Canada. This connectivity to a broad marketplace increases liquidity and opportunities for our clients as we maximize the value of their properties by accessing the largest pool of qualified buyers through our network of sales professionals and proprietary real estate inventory and marketing system. By closing more transactions annually than any other brokerage firm, our investment sales professionals are able to provide clients with a broad and deep perspective in multiple property types in real estate markets locally, regionally and nationally.
Our experienced management team is responsible for developing and mentoring our investment sales and financing professionals creating a consistent culture of information sharing and environment of best practices to maximize value for our clients. Our managers are compensated as executives incentivized to grow their offices and do not participate in commissions generated by our investment sales and financing professionals. This structure eliminates any competition with our salesforce and puts the emphasis on investment sales and financing professionals’ support and client service. In addition, we support our clients and investment sales and financing teams with market and property focused research, publications and custom analysis.
We generate revenues by collecting fees upon the sale and financing of commercial properties. These fees consist of commissions collected upon the sale of a property and fees collected from the placement of loans. The fees are principally based upon the sales price of the property or amount financed. In 2016, approximately 92% of our revenues were generated from real estate brokerage commissions, 6% from financing fees and 2% from other revenues, including consulting and advisory services.
Corporate Information
We were formed as a sole proprietorship in 1971, incorporated in California on August 26, 1976 as G. M. Marcus & Company, and we were renamed as Marcus & Millichap, Inc. in August 1978, Marcus & Millichap Real Estate Investment Brokerage Company in September 1985, and Marcus & Millichap Real Estate Investment Services, Inc. (“MMREIS”) in February 2007. Prior to the completion of our initial public offering (“IPO”), MMREIS was majority-owned by Marcus & Millichap Company (“MMC”) and all of MMREIS’ preferred and common stock outstanding was held by MMC and its affiliates or officers and employees of MMREIS. In June 2013, in preparation for the spin-off of its real estate investment services business (the “Spin-Off”), MMC formed a holding company called Marcus & Millichap, Inc. (“MMI”) in Delaware. Prior to the completion of our IPO, the shareholders of MMREIS contributed the shares of MMREIS to MMI in exchange for common stock of MMI, and MMREIS became a wholly owned subsidiary of MMI. On November 5, 2013, MMI completed its IPO.
Our principal executive offices are located at 23975 Park Sorrento, Suite 400 Calabasas, California 91302. Our telephone number at this location is (818) 212-2250. Our website address is www.MarcusMillichap.com. The information on our website is not part of, and is not incorporated into, this Annual Report on Form 10-K.
5
Competitive Strengths
We believe the following strengths provide us with a competitive advantage and opportunities for success:
National Platform Built on Investment Brokerage and Financing Services
We have built a leading national platform serving our clients’ needs of investment brokerage and financing services. We continue to be focused on investment brokerage and financing services as opposed to other businesses such as leasing or property management. We equip our highly qualified investment sales and financing professionals in 82 offices across the United States and Canada with proprietary real estate marketing technologies and processes to market investment real estate for our clients. Our commitment to specialization is reflected in how we generally organize our investment sales and financing professionals by market area and property type, which enhances our investment sales and financing professionals’ skills, relationships and market knowledge required for achieving the best results for our clients. As a result of these founding principles, we offer an efficient system of matching every property with the largest pool of qualified buyers and maximize value in the process.
Market Leader in the Private Client Market Segment
Since our founding in 1971, we have focused on being the leading service provider to the $1-$10 million private client market segment. This segment is the largest by ownership and transaction count and, consistently accounts for over 80% of total U.S. commercial property transactions. It is comprised of high-net-worth individuals, partnerships and small private fund managers with both passive, long-term investments, as well as those with opportunistic, short-term investment horizons. Private clients are often motivated to buy, sell and/or refinance properties due to personal circumstances such as death, divorce, partnership breakups and estate planning in addition to macroeconomic and capital market trends and events. The vast size and personal transaction drivers of private clients make this market segment the most active in terms of sales velocity. Therefore, sales in the private client market segment over the long term tend to be less volatile than higher priced properties priced at $10 million and above. In addition, this market segment is highly fragmented with the top ten brokerage firms accounting for approximately 24% of transactions in 2016. Marcus & Millichap is the leading broker in the $1-$10 million private client market segment with an 8.2% market share by transaction count. With our established market leadership and brand name, Marcus & Millichap has significant room for market share expansion by further consolidating its leadership position in this market segment.
In addition, the private client market segment is characterized by high barriers to entry. These barriers include the need for a large specialized salesforce prospecting private clients, difficulties in identifying, establishing and maintaining relationships with such investors, capabilities of exposing properties to a large pool of potential buyers and the challenge of serving their needs locally, regionally and nationally. We believe this private client market segment is the least covered market segment by other national firms and is significantly underserved by local and regional firms that lack a multi-market platform.
Platform Built for Maximizing Investor Value
We have built our business to maximize value for real estate investors through an integrated set of services geared toward our clients’ needs. We are committed to an investment brokerage specialization, provide one of the largest salesforce in the industry, a culture and policy of information sharing on each property we represent and equip our investment sales professionals with proprietary real estate inventory and marketing technologies that enhance the marketability of the properties we represent. Our system generates real-time buyer-seller matching and maximizes value one property at a time. Our investment sales organization can therefore underwrite, position and market investment real estate to the largest pool of qualified buyers. We coordinate proactive marketing campaigns across investor relationships and resources of the entire firm, far beyond the capabilities of an individual listing agent. These efforts produce wide exposure to investors who we identify as
6
high-probability bidders for each property. To grow with our clients, we established the IPA group to serve the needs of our private client investors that are now seeking higher valued properties as well as larger institutional investors. Our ability to bridge private capital with larger, institutional assets creates value for private and larger transaction clients while strengthening the retention of our investment sales and financing professionals.
We have one of the largest teams of financing professionals in the investment brokerage industry through Marcus & Millichap Capital Corporation (“MMCC”). MMCC provides financing expertise and access to debt and capital sources by identifying and securing competitive loan pricing and terms for our clients across a broad range of potential lenders and financing alternatives. We are a leading mortgage broker in the industry based on the number of financing transactions closed in 2015. Finally, our dedicated market research teams analyze the latest local and national economic and real estate trends and produce proprietary analyses for our clients enabling them to make informed investment and financing decisions. Our research team produces more than 1,000 reports, publications and briefs addressing real estate investment trends. Integrating all these services into one national platform increases opportunities to maximize value for our clients across multiple property types, market segments and geographies.
Management with Significant Investment Brokerage Experience
Our management team members, as executives of the firm, are dedicated to recruiting, training, developing and supporting our investment sales and financing professionals. The majority of our management team are former senior investment sales professionals of our Company who now focus on management, do not compete with our salesforce and have an average of approximately 10 years of real estate investment brokerage experience with our Company. Our training, development and mentoring programs rely greatly on the regional managers’ personal involvement. Their past experience as senior investment sales professionals plays a key role in developing new and experienced investment sales and financing professionals. They help our junior professionals establish technical and client service skills as well as setting up, developing and growing relationships with clients. We believe this management structure has helped differentiate the firm from our competitors and ultimately achieve better results for our clients.
Growth Strategy
We have a long track record of growing our business model driven by opening new offices, recruiting, training and developing new investment sales and financing professionals as well as deploying our client-focused business model to increase coverage of specialty property types and the middle and larger transaction market segments. Our long-term growth plan has focused on investing in our current business model through growing internally and by providing our unique business model to a wider client base. Since 2010, our revenue has increased threefold and we have grown from 1,033 investment sales and financing professionals to over 1,700 investment sales and financing professionals in the United States and Canada. Our future growth will depend on continually expanding our national footprint and optimizing the size, product segmentation and specialization of our team of investment sales and financing professionals. The key strategies of our growth plan include:
Increase Market Share in the Private Client Market Segment
The $1-$10 million private client market segment is fragmented and underserved. The top 10 brokerage firms accounted for only approximately 24% of 2016 transactions in this market segment. Our industry leading market share in this segment increased to 8.2% in 2016 from approximately 6.9% in 2012. Our leading position in this market segment and inherent fragmentation continues to provide significant opportunity for us to expand and bring our client service offerings to a larger portion of this expansive market segment. We can continue to leverage our existing platform, relationships and brand recognition among private clients to grow through expanded marketing and coverage.
7
Focused Office Expansion
Since we currently have offices in most major-market and mid-market metropolitan cities, our growth is expected to come from focused office expansion, targeted hiring and increased coverage of specialty property types. We have targeted markets based on population, employment, level of commercial real estate sales, inventory and competitive landscape. Our optimal office plans are used to capitalize on these factors by tailoring salesforce size, coverage and composition by office and business activity to direct resources to offices with the most opportunity where we believe we can leverage our national footprint and proprietary real estate marketing technologies. These initiatives do not require a significant increase in the number of offices or a significant increase in the size of our offices, which allows us to leverage our current office locations without significant incremental investment.
Expand and Develop Our Team of Investment Sales Professionals
A key to growing our business is hiring, training and developing investment sales professionals. We have increased our focus on hiring experienced investment sales professionals through our recruiting department, specialty directors and regional managers in support of our optimal office plans. Our new investment sales professionals are trained in all aspects of real estate fundamentals, client service and proprietary marketing technologies through formal training, apprenticeship programs and mentorship by our dedicated regional, district and division managers. As these investment sales professionals mature, we continue to provide them with identified best practices and training in specialty property types. We believe this model creates a high level of teamwork, as well as operational and client service consistency. During 2016, we reached an all-time high in the number of investment sales professionals, ending the year with over 1,600.
Grow in Specialty Property Types and Middle and Larger Transaction Market Segment Presence
Leveraging our current business model into specialty property types and to the middle and larger transaction market segments opens up significant opportunities for growth.
Specialty Property Types
We believe that specialty property types, including hospitality, self-storage, seniors housing, land and manufactured housing offer significant opportunities for our clients. By deploying our unique business model to increase coverage of these property types, we can create growth for us as well as enhance value for our clients through diversification. To create these opportunities, we are increasing our property type expertise by continuing to strategically add specialty directors who can bring added management capacity, business development and investment sales professional support. These executives will work with our sales management team to increase investment sales professional hiring, training, development and redeployment and to execute various branding and marketing campaigns to expand our presence in these targeted property types. The number and volume of transactions in the primary property types of multifamily, retail, office and industrial should continue to grow with upside opportunity, particularly in the office and industrial properties. At the same time, we intend to continue to grow our presence in specialty property types, which increased 1.2% in number of transactions and 10.5% in volume in 2016 compared to 2015.
Middle and Larger Transaction Market Segments Presence
Our extensive relationships with private client investors who typically invest in the $1-$10 million private client market segment have enabled us to capture a greater portion of commercial real estate transactions in excess of $10 million and bridge the private client market investor to the middle market and larger transaction market segments in recent years. As property values increase and investors grow and expand, they require larger properties and we are organized to provide our unique brokerage and financing services to them in those market segments. Our ability to connect historically private client capital with middle and larger transaction market
8
segment properties allows us to continue to serve our clients as they grow and plays a major role in differentiating our services. In 2011, we introduced a group dedicated to serving major investors branded as Institutional Property Advisors, specifically to service larger multifamily investors. This strategy has met with great success and market acceptance and provides a vehicle for growth by delivering our unique service platform within the middle and larger transaction multifamily, retail and office property types. The growth of our investors and introduction of IPA has driven incremental growth for us. Brokerage commissions from the middle and larger transaction market segments increased approximately 13.6% to $185.6 million in 2016 from $163.4 million in 2015.
Expand Marcus & Millichap Capital Corporation Financing Business
We are dedicated to growing our financing services through our MMCC platform. Our focus continues to be expanding financing services in markets currently served by our investment brokerage offices, increasing the capacity of financing professionals in offices we currently serve, integrating financing professionals in offices that do not have an MMCC presence and expanding our service platform by creating access to other capital resources such as mezzanine financing, HUD products, equity placement and conduit financing. In addition, we have recently established alliances with lenders with government-sponsored enterprise (“GSE”) licenses, expanding their distribution network while affording our loan originators and clients with more favorable pricing and service. Our internally developed training programs are directed to enhancing our internal branding, skill development, increasing our internal capture rate and cross-selling with a focus on the MMCC value proposition for our brokerage and non-brokerage clients. We will continue to seek out and hire experienced financing professionals and capital markets teams to grow our MMCC business to support the growth in our service platform and establish relationships with various capital sources. We have grown the number of financing professionals to 103 in 2016 from 98 in 2015. As of December 31, 2016, we have 46 offices with financing professionals embedded within our brokerage teams. We continue to capitalize on the synergies our financing professionals provide to our client focused service platform with approximately 2% growth in financing fees to $43.4 million in 2016 from $42.6 million in 2015.
Our Company
We provide investment brokerage and financing services to investors of all sizes and types of commercial real estate properties. We are the leading national investment brokerage company in the $1-$10 million private client market segment. This is the largest and most active market segment and comprised approximately 84% of total U.S. commercial property transactions in 2016. We have over 1,700 investment sales and financing professionals in 82 offices in the United States and Canada. We have 59 offices concentrated in 48 major markets consisting of metropolitan areas with a population of at least 1 million and 23 offices in 23 mid-market locations consisting of metropolitan areas with a population of less than 1 million. We leverage our relationships with investors and use proprietary marketing tools to match properties with qualified buyers. Our financing professionals obtain competitive debt financing for buyers of our properties and owners who need to refinance or restructure their positions.
We have a 46-year history in the real estate marketplace. The real estate market is cyclical, and our results are impacted by many macroeconomic and microeconomic factors as discussed in Item 1A – Risk Factors. We have demonstrated the ability, over the long-term, to manage through the cyclical market and continue to be a leader in the $1-10 million private client market segment. The most recent downturn began in 2007 when the global credit markets began to show signs of distress resulting in a shortage of liquidity in some financing markets, including real estate. Beginning in late 2008, the credit crisis and recession greatly affected the commercial real estate industry, resulting in a dramatic decline in sales volume and number of transactions. Despite the severity of the market downturn, we maintained all of our offices and services, enabling us to quickly take advantage of the market recovery and resume our growth. As the real estate and financing markets recovered after 2009, our sales volume has steadily grown and now exceeds pre-downturn levels both as a result of the market transaction growth and executing our growth initiatives, which expanded our market presence.
9
The following graph shows the number of transactions and sales volume of investment sales, financing and other transactions from 2007 to 2016:
Geographic Locations
We have grown to have offices in 35 states across the United States and in three provinces in Canada, with over 1,700 investment sales and financing professionals in 59 offices in major metropolitan markets and 23 offices in mid-market locations. Below is a map reflecting the geographic location of our offices as of December 31, 2016.

10
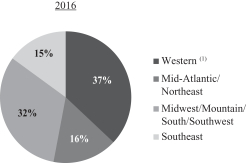
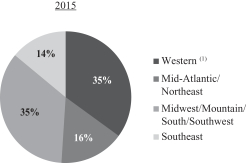
Geographic Concentrations
We were founded in 1971 in the western United States and we continue to increase our presence in states in the Mid-Atlantic, Northeast, Midwest, Mountain and the South regions through execution of our growth strategies by targeting markets based on population, employment, level of commercial real estate sales, inventory and competitive landscape opportunities where we believe the markets will benefit from our business model. The following charts set forth the percentage of transactions by region for our investment sales transactions in 2016 and 2015.
|
|
| (1) | Includes our Canadian operations, which represented less than 1.0% of our total revenues in each period presented. |
Commercial Real Estate Market Segments
We divide the commercial real estate market into four major market segments, characterized by investment size. Our strength is in serving private clients in the $1-$10 million private client market segment, which contributed approximately 68% of our brokerage commissions in 2016. In addition, we achieved growth by leveraging the strength of our relationships in the private client market segment to increase our share of the middle and larger transaction market segments. Commission percentages are generally lower in the middle and larger transaction market segments since commission rates earned on commercial properties are typically inversely correlated with sales price. Because of the expansion into the middle and larger transaction market segments, we have seen our average commission rates fluctuate from period-to-period as a result of changes in the relative mix of transactions closed in the middle and larger transaction market segments as compared to the private client market segment.
The following table sets forth the number of transactions, sales volume and revenue by commercial real estate market segment for real estate brokerage in 2016 compared to 2015:
| 2016 | 2015 | Change | ||||||||||||||||||||||||||||||||||
| Real Estate Brokerage: |
Number | Volume | Revenues | Number | Volume | Revenues | Number | Volume | Revenues | |||||||||||||||||||||||||||
| (in millions) | (in thousands) | (in millions) | (in thousands) | (in millions) | (in thousands) | |||||||||||||||||||||||||||||||
| <$1 million |
1,070 | $ | 682 | $ | 29,217 | 1,174 | $ | 718 | $ | 29,971 | (104 | ) | $ | (36 | ) | $ | (754 | ) | ||||||||||||||||||
|
Private Client Market ($1-$10 million) |
4,779 | 15,274 | 447,366 | 4,611 | 14,898 | 439,164 | 168 | 376 | 8,202 | |||||||||||||||||||||||||||
| Middle Market (³$10-$20 million) |
374 | 5,099 | 88,568 | 352 | 4,776 | 89,886 | 22 | 323 | (1,318 | ) | ||||||||||||||||||||||||||
|
Larger Transaction Market (³$20 million) |
253 | 10,907 | 97,069 | 195 | 8,052 | 73,553 | 58 | 2,855 | 23,516 | |||||||||||||||||||||||||||
|
|
|
|
|
|
|
|
|
|
|
|
|
|
|
|
|
|
|
|||||||||||||||||||
| 6,476 | $ | 31,962 | $ | 662,220 | 6,332 | $ | 28,444 | $ | 632,574 | 144 | $ | 3,518 | $ | 29,646 | ||||||||||||||||||||||
|
|
|
|
|
|
|
|
|
|
|
|
|
|
|
|
|
|
|
|||||||||||||||||||
Property Type
We have a long history and significant expertise in our primary property types of multifamily, retail, office and industrial. We have expanded our expertise in the specialty property types by hiring and assigning specialty directors to coordinate our national presence in these property types and expand our market share.
11
The following table sets forth the number and sales volume (dollars in billions) of investment sales, financing and other transactions in 2016 compared to 2015 by property type:
| 2016 | 2015 | Change | ||||||||||||||||||||||
| Number | Volume | Number | Volume | Number | Volume | |||||||||||||||||||
| Primary Property Types: |
||||||||||||||||||||||||
| Multifamily |
3,308 | $ | 20.2 | 3,382 | $ | 17.9 | (74 | ) | $ | 2.3 | ||||||||||||||
| Retail |
3,671 | 12.0 | 3,351 | 10.8 | 320 | 1.2 | ||||||||||||||||||
| Office |
585 | 2.8 | 567 | 2.4 | 18 | 0.4 | ||||||||||||||||||
| Industrial |
255 | 1.0 | 253 | 1.0 | 2 | — | ||||||||||||||||||
|
|
|
|
|
|
|
|
|
|
|
|
|
|||||||||||||
| Total Primary Property Types |
7,819 | $ | 36.0 | 7,553 | $ | 32.1 | 266 | $ | 3.9 | |||||||||||||||
|
|
|
|
|
|
|
|
|
|
|
|
|
|||||||||||||
| Specialty Property Types: |
||||||||||||||||||||||||
| Seniors Housing |
85 | 1.5 | 83 | 0.9 | 2 | 0.6 | ||||||||||||||||||
| Hospitality |
242 | 1.3 | 225 | 1.6 | 17 | (0.3 | ) | |||||||||||||||||
| Self-Storage |
190 | 1.3 | 201 | 0.9 | (11 | ) | 0.4 | |||||||||||||||||
| Land |
267 | 0.8 | 266 | 0.6 | 1 | 0.2 | ||||||||||||||||||
| Manufactured Housing |
113 | 0.4 | 101 | 0.4 | 12 | — | ||||||||||||||||||
| Mixed – Use / Other |
279 | 1.0 | 286 | 1.3 | (7 | ) | (0.3 | ) | ||||||||||||||||
|
|
|
|
|
|
|
|
|
|
|
|
|
|||||||||||||
| Total Specialty Property Types |
1,176 | $ | 6.3 | 1,162 | $ | 5.7 | 14 | $ | 0.6 | |||||||||||||||
|
|
|
|
|
|
|
|
|
|
|
|
|
|||||||||||||
| 8,995 | $ | 42.3 | 8,715 | $ | 37.8 | 280 | $ | 4.5 | ||||||||||||||||
|
|
|
|
|
|
|
|
|
|
|
|
|
|||||||||||||
Our Services
We serve clients with one property, multiple properties and large investment portfolios. The largest group of investors we serve typically transacts in the $1-$10 million private client market segment. Properties in this market segment are characterized by higher asset turnover rates due to the type of investor as compared to other market segments. Investors in the private client market segment typically transact due to personal circumstances and business reasons, such as death, divorce, changes in partnership structures and other personal or financial circumstances. Therefore, private client investors are influenced less by the macroeconomic trends than other large scale investors, making the private client market segment less volatile over the long-term than other market segments. We offer three primary services to our clients, commercial real estate investment brokerage and financing and ancillary services including other research, advisory and consulting services.
Commercial Real Estate Investment Brokerage
Our primary business and source of revenue is the representation of commercial property owners as their exclusive investment broker in the sale of their properties. Commissions from real estate investment brokerage sales accounted for approximately 92% of our revenues in 2016. Sales are generated by maintaining relationships with property owners, providing market information and trends to them during their investment or “hold” period and being selected as their representative when they decide to sell, buy additional property or exchange their property for another property. We collect commissions upon the sale of each property based on a percentage of sales price. These commission percentages are typically inversely correlated with sales price and thus are generally higher for smaller transactions. Our investment sales professionals also represent buyers in fulfilling their investment real estate acquisition needs; however, the vast majority of our investment sales business is generated from our exclusive representation of sellers.
We underwrite, value, position and market properties to reach the largest and most qualified pool of buyers. We offer our clients the industry’s largest team of investment sales professionals, who operate with a culture and policy of information sharing powered by our proprietary system, MNet, which enables real-time buyer-seller matching. We use a proactive marketing campaign that leverages the investor relationships of our entire
12
salesforce, direct marketing and a suite of proprietary web-based tools that connects each asset with the right buyer pool. We strive to maximize value for the seller by generating high demand for each property. Our approach also provides a diverse, consistently underwritten inventory of investment real estate for buyers. When a client engages one of our investment sales professionals, they are engaging an entire system, structure and organization committed to maximizing value for them.
In 2016, we closed 6,476 real estate brokerage transactions in a broad range of commercial property types, with a total sales volume of approximately $32.0 billion. In the last 10 years, we have closed more transactions than any other firm. We have significantly diversified our business beyond our historical focus on multifamily properties.
The majority of our business activity is in the $1-$10 million private client market segment and is aligned with the largest real estate market segment. During 2016, we closed 4,779 real estate brokerage transactions in this market segment, which comprised approximately 88% of our total real estate brokerage transactions greater than $1 million and 71% of our brokerage commissions for transactions greater than $1 million. Of the commercial real estate industry as a whole, the $1-$10 million private client market segment represented over 80% of total U.S. commercial property transactions greater than $1 million in 2016.
We are building on our track record of growth in multifamily, retail, office and industrial properties by expanding our coverage of additional property types. These include hospitality, self-storage, seniors housing, land and manufactured housing properties, where we are already a leading broker but have significant room for additional growth due to market size, fragmentation and specific geographic market opportunities. We are also expanding our specialty group management and support infrastructure, specialized branding and business development customized for each property type and intensifying our recruiting efforts, for management and investment sales and financing professionals. These efforts should expand our presence and result in increased business in these property types.
Financing
MMCC is a broker of debt financing for commercial properties principally in the under $10 million market segments. We generate revenue in the form of financing fees collected from the placement of loans with banks, insurance companies, government agencies, commercial mortgage backed securities (“CMBS”) and conduits. In addition to placing financing for acquisitions, we also place loans for refinancing for individual assets and portfolios. MMCC’s financing fees vary by loan amount and type. In 2016, MMCC completed more than 1,600 financing transactions with a sales volume of approximately $5.1 billion and accounted for approximately 6% of our revenues. MMCC’s size, market reach and sales volume enable us to establish long-term relationships and special programs with various capital sources. This, in turn, improves MMCC’s value proposition to borrowers seeking competitive financing rates and terms. MMCC is not limited to promoting in-house or exclusive capital sources and seeks the most competitive financing solution for each client’s specific needs and circumstances. During 2016, approximately 48% of MMCC’s revenues came from placing acquisition financing, 49% from refinance activities and 3% from other financing activities.
MMCC is fully integrated with our investment salesforce in our brokerage offices. MMCC financing professionals are supervised by our regional managers, who promote cross-selling, information sharing, business referrals and high quality client service. The MMCC national network of financing professionals is supported by a dedicated, nationally focused management team coordinating access to a broad range of national and regional capital sources including bank lenders, conduit lenders, CMBS lenders, structured debt facilitators (mezzanine and preferred equity), HUD and other GSE lenders. With these resources coupled with the latest property and capital markets information, we are able to access and deliver the best loan structures, financing rates and terms to meet our clients’ financial objectives.
13
Ancillary Services: Research, Advisory and Consulting
Our research, advisory and consulting services are designed to assist clients in forming their investment strategy and making transaction decisions. Our advisory and consulting services are coordinated with both our investment sales and financing professionals and are designed to provide market and property focused market research, publications and customized analysis that increase customer loyalty and long-term relationships.
We also provide a wide range of advisory and consulting services to developers, lenders, owners, real estate investment trusts, high net worth individuals, pension fund advisors and other institutions. Our advisory services include opinions of value, operating and financial performance benchmarking analysis, specific asset buy-sell strategies, market and submarket analysis and ranking, portfolio strategies by property type, market strategy and development and redevelopment feasibility studies.
Seasonality
There is seasonality in our real estate brokerage commissions and financing fees, which has generally caused our revenues, operating income, net income and cash flows from operating activities to be lower in the first half of the year and higher in the second half of the year, particularly in the fourth quarter. For a more detailed description of our seasonality, refer to Item 1A – Risk Factors – External Business Risks – “Seasonal fluctuations and other market data in the investment real estate industry could adversely affect our business and make comparisons of our quarterly results difficult” and Item 7 – Management’s Discussion and Analysis of Financial Condition and Results of Operations – Overview – Seasonality of this Annual Report on Form 10-K.
Competition
We compete in real estate brokerage and financing within the commercial real estate industry on a national, regional and local basis. Competition is based on a number of critical factors, including the quality and expertise of our investment sales and financing professionals, our execution skills, sales support, brand recognition and our business reputation. We primarily compete with other brokerage and financing firms that seek investment brokerage and financing business from real estate owners and investors. To a lesser extent, we compete with in-house real estate departments, owners who may transact without using a brokerage firm, direct lenders, consulting firms and investment managers, some of which may have greater financial resources than we do. Our relative competitive position also varies across geographies, property types and services. In investment sales, our competitors on a national level include CBRE Group, Inc., Cushman & Wakefield, Colliers International, HFF, Inc. and Jones Lang LaSalle. Our major financing competitors include HFF, Inc., CBRE Group, Inc., Jones Lang LaSalle, Walker & Dunlop, Berkadia Commercial Mortgage LLC, Grandbridge Real Estate Capital and NorthMarq Capital, LLC. The investment sales firms mainly focus on larger sales and institutional investors and are not heavily concentrated in our largest market segment, which is the $1-$10 million private client market segment. However, there is crossover and competition between us and these firms. As a result of the fragmentation in the market, there are also numerous local and regional competitors in our markets, as well as competitors specializing in certain property types. Despite recent consolidation, the commercial real estate services industry remains highly fragmented and competitive.
Competition to attract and retain qualified professionals is also intense in each of our geographic regions and across all property types. We offer what we believe to be competitive compensation and support programs to our professionals. Our ability to continue to compete effectively will depend on retaining, motivating and appropriately compensating our professionals.
Technology
We have a long-standing tradition of technological orientation, innovation and advancement. Our efforts include the development of proprietary applications designed to make the process of matching buyer and sellers faster and more efficient as well as state-of-the-art communication technology, infrastructure, internet presence and electronic marketing.
14
We have a proprietary internal marketing system, MNet, which allows our salesforce to share listing information with investors across the country. MNet is an integrated tool that contains our entire national property inventory, which allows our salesforce to search for properties based on investors’ acquisition criteria. This system is an essential part of connecting buyers and sellers through our national platform. Our policies require information sharing among our salesforce, and the MNet system automates the process of matching each property we represent to the largest pool of qualified buyers tracked by our national salesforce. A part of MNet, called Buyer Needs, enables our salesforce to register the investment needs of various buyers, which are then matched to our available inventory on a real-time basis.
In 2016, we began the deployment of an improved proprietary system for automating the production of property marketing materials and launching marketing campaigns, which we call MNet-Offering, replacing our previous system called iMpact. MNet-Offering allows our investment sales professionals to create a listing proposal or marketing package, which automatically imports property information, data on comparable properties and other information, and then dynamically populates our e-marketing, print, and Internet media. This system allows our salesforce to rapidly create professionally branded and designed materials for marketing properties on behalf of our clients in an efficient and timely manner. This new web-based application improves salesforce efficiency by tightly integrating MNet data for transaction history, sales and rent comparables, and market insights that differentiate our salesforce in the marketplace. The proposals and marketing packages produced by MNet-Offering also deliver updated content and expanded demographic and financial analysis to better market those properties for our clients. We will complete the rollout of MNet-Offering for all property types in the first half of 2017 and, subsequently, sunset the legacy iMpact application.
We rebuilt our website in 2014 to enhance our interactions with buyers and sellers of properties. Our website is designed not only to bring in new clients for our investment sales and financing professionals, but also to make our inventory of properties available for maximum exposure for our sellers and providing buyers an opportunity to engage with our investment sales and financing professionals. We actively qualify leads generated from the contact forms, and pass those leads to our agents via our customer relationship management platform. Our website averages 59,117 visitors per month and nearly 900,000 page views per month (all based on data from Google Analytics) and also serves as a portal for delivery of online marketing materials and for deal collaboration.
Marketing and Branding
Our 46 years of investment brokerage specialization and concentration in the $1-$10 million private client market segment have established our brand as the leading broker of investment real estate as well as a trusted source of financing solutions and market research. In recent years we have also garnered recognition among larger private investors and institutions due to our integrated platform and capability of linking private and institutional capital. We continue to strengthen and broaden the Company’s name recognition and credibility by executing a variety of marketing and branding strategies. Locally, our offices and investment sales and financing professionals engage in numerous events, direct mail campaigns, investor symposiums and participate in real estate conferences and organizations for various market segments and property types. Our regional managers and investment sales and financing professionals develop long-term client relationships and promote the Company’s brand through these activities.
Our research division produces more than 1,000 publications and client presentations per year and has become a leading source of information for the industry as well as the general business media. We provide research on 10 commercial property types covering: multifamily, retail, office, industrial, single-tenant net lease, seniors housing, student housing, self-storage, hospitality, medical office, manufactured housing and tax credit low income housing, as well as capital markets/financing. This research includes analysis and forecasting of the economy, capital markets, real estate fundamentals, investment, pricing and yield trends, and is designed to assist investors in their strategy formation and decisions relating to specific assets and help our investment sales professionals develop and maintain relationships with clients.
15
Our transactional and market research expertise result in significant print, radio, television and online media coverage including most major real estate publications such as Real Estate Forum, Multi-Housing News, Commercial Property Executive and National Real Estate Investor as well as local market and major national news outlets such as CNBC, Fox Business, The Wall Street Journal, Los Angeles Times, Chicago Tribune, Bloomberg Businessweek, Forbes and Investors Business Daily. Our CEO is frequently interviewed on national business channels, such as CNBC, Bloomberg and Fox Business, to address the commercial real estate market. We frequently have featured speaking roles in key regional and national industry events, and we are regularly quoted in regional and national publications and media, and deliver content directly to the real estate investment community through print, electronic publications and video. Nationally, our specialty groups and capital markets executives actively participate in various trade organizations, many of which focus on specific property types and provide an effective vehicle for client relationship development and branding.
We believe all these activities create significant exposure and name recognition for our firm, which fosters and builds strong, long-term client relationships.
Intellectual Property
We hold various trademarks and trade names, which include the “Marcus & Millichap” name. Although we believe our intellectual property plays a role in maintaining our competitive position in a number of the markets that we serve, we do not believe we would be materially, adversely affected by the expiration or termination of our trademarks or trade names or the loss of any of our other intellectual property rights other than the Marcus & Millichap name. With respect to the Marcus & Millichap name, we maintain trademark registrations for these service marks.
In addition to trade names, we have developed proprietary technologies for the provision of real estate investment services, such as MNet, MNet-Offering and iMpact. We also offer proprietary research to clients through our research division. While we seek to secure our rights under applicable intellectual property protection laws in these and any other proprietary assets that we use in our business, we do not believe any of these other items of intellectual property are material to our business in the aggregate.
Government Regulation
We are subject to various real estate regulations, as such we maintain real estate and other broker licenses in 45 states in the United States and three provinces in Canada. We are a licensed broker in each state in which we have an office, as well as those states where we frequently do business. We are also subject to numerous other federal, state and local laws and regulations that contain general standards for, and prohibitions on, the conduct of real estate brokers and sales associates, including agency duties, collection of commissions, telemarketing, advertising and consumer disclosures.
Employees and Investment Sales and Financing Professionals
As of December 31, 2016, we had 1,737 investment sales and financing professionals of which 1,642 are exclusive independent contractors and the remainder are our employees.
We had 748 employees as of December 31, 2016, consisting of 95 financing professionals, 22 in communications and marketing, 20 in research and 611 in management, support and general and administrative functions. We believe our employee relations are good.
Most of the Company’s investment sales professionals are classified as independent contractors under state and IRS guidelines. As such, the Company generally does not pay for the professional’s expenses or benefits or withhold payroll taxes; rather they are paid from the commissions earned by the Company upon the closing of a transaction, and these individuals do not earn a salary from which taxes are withheld. Almost all of the
16
investment sales professionals hold applicable real estate sales licenses and execute a “Salespersons Agreement” setting out the relationship between the professional and the Company. Each professional is obligated to provide brokerage services exclusively to the Company, and is provided access to the Company’s information technology, research and other support and business forms. Each professional generally reports on their activities to either the local regional manager, or in some cases, to product specialty managers.
Our investment sales and financing professionals are located in offices throughout the United States and Canada, each led by a regional manager with previous investment brokerage experience and an active brokerage license. We have regional managers and investment sales managers, who are responsible for hiring, developing and deploying investment sales professionals, managing regional and mid-market offices and supervising MMCC originators and support staff in their area of responsibility. We also have seven division managers who oversee multiple offices; division managers hire, develop, and support our office management and provide additional leadership and support for our local sales management team. Finally, our management structure includes national specialty directors who lead each property type. Our national specialty directors develop our national and local brand in each property type, develop major accounts and coordinate multi-market assignments on behalf of large clients.
Traditionally, our growth has been driven by recruiting, training and developing new investment sales and financing professionals. Our new investment sales and financing professionals are trained in our technical and client service standards through a comprehensive program starting with pre-training, formal training and apprenticeship programs. While continuing to improve the recruiting, training and developing of new investment sales and financing professionals remains a major priority, we have also expanded our strategy to include more experienced investment sales and financing professionals who fit our culture and values. Over the past several years, experienced investment sales and financing professionals, including some top performers previously with national competitors, have joined the firm and have become productive members of our team. As investment sales and financing professionals mature, we continue with specialized training and best practices sessions by tenure, which are conducted by senior management, regional managers, leading investment sales professionals and our national specialty directors. The goal of this rigorous approach to training is to continually improve our team’s skill set and client services. Our salesforce conducts business the same way across the country to deliver a high level of consistency, professionalism and reliability to our clients who often buy and sell investments in variety of property types and locations.
Our investment sales and financing professionals receive a percentage of the commission received by the Company. As investment sales and financing professionals become more senior, they receive a larger percentage of the commission based on tenure and production. Depending on the aggregate gross commissions, a portion of the investment sales and financing professional’s commission may be deferred for three years.
Emerging Growth Company Status
We currently are an “emerging growth company,” as defined in the Jumpstart Our Business Startups Act of 2012 (the “JOBS Act”), and are eligible to take advantage of certain exemptions from various reporting requirements that are applicable to other public companies that are not “emerging growth companies,” including, but not limited to, not being required to comply with the auditor attestation requirements of Section 404 of the Sarbanes Oxley Act of 2002, reduced disclosure obligations regarding executive compensation in our periodic reports and proxy statements and exemptions from the requirements of holding a non-binding advisory vote on executive compensation and stockholder approval of any golden parachute payments not previously approved.
We have irrevocably elected to opt out of the extended transition period for complying with new or revised accounting standards pursuant to Section 107(b) of the JOBS Act, and therefore, we are subject to the same new or revised accounting standards as other public companies that are not “emerging growth companies.”
We could remain an “emerging growth company” for up to five years, or until the earliest of (i) the last day of the first fiscal year in which our annual gross revenues exceed $1 billion, (ii) the date that we become a “large
17
accelerated filer” as defined in Rule 12b-2 under the Securities Exchange Act of 1934, as amended (the “Exchange Act”), which would occur if the market value of our common stock that is held by non-affiliates exceeds $700 million as of the last business day of our most recently completed second fiscal quarter, or (iii) the date on which we have issued more than $1 billion in non-convertible debt during the preceding three-year period.
Available Information
Our website address is www.MarcusMillichap.com. Information on our website does not constitute part of this report and inclusions of our internet address in this Annual Report on Form 10-K are inactive textual references only. We are required to file current, annual and quarterly reports, proxy statements and other information required by the Exchange Act, with the SEC. We make available free of charge through a link provided on our website our annual reports on Form 10-K, quarterly reports on Form 10-Q, current reports on Form 8-K, proxy statements, Forms 3, 4 and 5 filed by or on behalf of directors, executive officers and certain large stockholders, and any amendments to those documents filed or furnished pursuant to the Exchange Act. Such reports are available as soon as reasonably practicable after they are filed with the SEC.
The public may read and copy any materials we file with the SEC at the SEC’s Public Reference Room at 100 F Street, N.E., Washington, D.C. 20549. The public may obtain information on the operation of the Public Reference Room by calling the SEC at 1-800-SEC-0330. The SEC also maintains a website that contains reports, proxy and information statements and other information regarding the Company that we file electronically with the SEC at www.sec.gov.
We also make available on our website and will provide print copies to stockholders upon request, (i) our corporate governance guidelines, (ii) our code of ethics, and (iii) charters of the audit, compensation, corporate governance and nominating committees of our board of directors.
From time to time, we may announce key information in compliance with Regulation FD by disclosing that information on our website.
18
Investing in our securities involves a high degree of risk. You should consider carefully the following risk factors and the other information in this Annual Report on Form 10-K, including our consolidated financial statements and related notes, before making any investment decisions regarding our securities. If any of the following risks actually occur, our business, financial condition and operating results could be adversely affected. As a result, the trading price of our securities could decline and you may lose part or all of your investment.
Overview
We are impacted by and manage many risk factors detailed below affecting our business including External Business Risks, Human Resource and Personnel Risks, Internal Business Risks, and Risks related to the Ownership of Our Common Stock. Many of these factors described below in External Business Risk, are outside of our control. In addition, we are a personnel and relationship intensive business rather than a capital intensive business. While all the risk factors discussed below have the potential to negatively impact our business, the most significant risks facing the Company are the general economic conditions and commercial real estate market conditions risk and our ability to attract and retain qualified and experienced managers and investment sales and financing professionals.
External Business Risks
General economic conditions and commercial real estate market conditions have had and may in the future have a negative impact on our business.
We may be negatively impacted by periods of economic downturns, recessions and disruptions in the capital markets; credit and liquidity issues in the capital markets, including international, national, regional and local markets; and corresponding declines in the demand for commercial real estate investment and related services. Historically, commercial real estate markets and, in particular, the U.S. commercial real estate market, have tended to be cyclical and related to the flow of capital to the sector, the condition of the economy as a whole and to the perceptions and confidence of the market participants as to the relevant economic outlook. Cycles in the real estate markets may lead to similar cycles in our earnings and significant volatility in our stock price. Further real estate markets may “lag” behind the broader economy such that even when underlying economic fundamentals improve in a given market, additional time may be required for these improvements to translate into strength in the real estate markets. The “lag” may be exacerbated when banks delay their resolution of commercial real estate assets whose values are less than their associated loans.
Negative economic conditions, changes in interest rates, credit and liquidity issues in the capital markets, disruptions in capital markets and/or declines in the demand for commercial real estate investment and related services in international and domestic markets or in significant markets in which we do business, have had and could have in the future a material adverse effect on our business, results of operations and/or financial condition. In particular, the commercial real estate market is directly impacted by (i) the lack of debt and/or equity for commercial real estate transactions, (ii) increased interest rates and changes in monetary policies by the U.S Federal Reserve, (iii) changes in the perception that commercial real estate is an accepted asset class for portfolio diversification, and (iv) slowdowns in economic activity that could cause residential and commercial tenant demand to decline, which would adversely affect the operation and income of commercial real estate properties.
These and other types of events could lead to a decline in transaction activity as well as a decrease in values which, in turn, would likely lead to a reduction in brokerage commissions and financing fees relating to such transactions. These effects would likely cause us to realize lower revenues from our transaction service fees, including investment sales commissions, which fees usually are tied to the transaction value and are payable upon the successful completion of a particular transaction. Such declines in transaction activity and value would likely also significantly reduce our financing activities and revenues. For example, the disruptions and
19
dislocations in the global credit markets during 2008 and 2009 created significant restrictions in the availability of credit, especially on transitional assets and in the secondary and tertiary markets. In turn, the volume and pace of commercial real estate transactions were significantly reduced, as were property values, which generally peaked in 2007 and fell through 2010.
Fiscal uncertainty, significant changes and volatility in the financial markets and business environment and similar significant changes in the global, political, security and competitive landscape, make it increasingly difficult for us to predict our revenue and earnings into the future. As a result, any revenue or earnings guidance or outlook which we may give may be affected by such events or may otherwise turn out to be inaccurate.
In addition, the Trump administration’s prospective modifications to fiscal, monetary and regulatory policies could have significant implications for investors in commercial real estate and our business. Such modifications could significantly affect our business, but the effects are unknown at this time.
We have numerous significant competitors and potential future competitors, some of which may have greater resources than we do, and we may not be able to continue to compete effectively.
We compete in investment sales and financing within the commercial real estate industry. Our investment sales focus is on the private client market segment, which is highly fragmented. The fragmentation of our market makes it challenging to effectively gain market share. While we have a competitive advantage over other national firms in the private client market segment, we also face competition from local and regional service providers who have existing relationships with potential clients. Furthermore, transactions in the private client market segment are smaller than many other commercial real estate transactions. Although the brokerage commissions in this segment are generally a higher percentage of the sales price, the smaller size of the transactions requires us to close many more transactions to sustain revenues. If the commission structure or the velocity of transactions were to change, we could be disproportionately affected by changes compared to other companies that focus on larger transactions, institutional clients and other segments of the commercial real estate market.
There is no assurance that we will be able to continue to compete effectively, maintain our current fee arrangements with our private clients, maintain current margin levels or counteract increased competition. The services we provide to our clients are highly competitive on a national, regional and local level. Depending on the geography, property type or service, we face competition from, including, but not limited to, commercial real estate service providers, in-house real estate departments, private owners and developers, commercial mortgage servicers, institutional lenders, research and consulting firms, and investment managers, some of whom are clients and many of whom may have greater financial resources than we do. In addition, future changes in laws and regulations could lead to the entry of other competitors. Many of our competitors are local, regional or national firms. Although most are substantially smaller than we are, some of these competitors are larger on a local, regional or national basis, and we believe more national firms are exploring entry into or expansion in the $1-$10 million private client market segment. We may face increased competition from even stronger competitors in the future due to a trend toward acquisitions and consolidation. We are also subject to competition from other large national and multi-national firms as well as regional and local firms that have similar service competencies to ours. Our existing and future competitors may choose to undercut our fees, increase the levels of compensation they are willing to pay to their employees and investment sales and financing professionals, and either recruit our employees and investment sales and financing professionals or cause us to increase our level of compensation necessary to retain employees or investment sales and financing professionals, or recruit new employees or investment sales and financing professionals. These occurrences could cause our revenue to decrease, and/or expenses to increase which could have an adverse effect on our business, financial condition and results of operations.
Our brokerage operations are subject to geographic and commercial real estate market risks, which could adversely affect our revenues and profitability.
Our real estate brokerage offices are located in and around large metropolitan areas as well as mid-market regions throughout the United States and Canada. Local and regional economic conditions in these locations
20
could differ materially from prevailing conditions in other parts of the country. We realize more of our revenues in California. In 2016, we earned approximately 35% in California. In particular, as a result of this concentration, we are subject to risks related to the California economy and real estate markets more than in other geographic markets. In addition to economic conditions, this geographic concentration means that California-specific legislation, taxes and regional disasters, such as earthquakes, could disproportionately affect us. A downturn in investment real estate demand or economic conditions in these regions could result in a further decline in our total gross commission income and profitability and have a material adverse effect on us.
Seasonal fluctuations and other market data in the investment real estate industry could adversely affect our business and make comparisons of our quarterly results difficult.
Our revenue and profits have historically tended to be significantly higher in the second half of each year than in the first half of the year. This is a result of a general focus in the real estate industry on completing or documenting transactions by calendar year end and because certain expenses are constant throughout the year. Historically, we have reported relatively lower earnings in the first quarter and then increasingly larger earnings during each of the following three quarters. This historical trend can be disrupted both positively and negatively by major economic or political events impacting investor sentiment for a particular property type or location, current and future projections of interest rates, attractiveness of other asset classes, market liquidity and the extent of limitations or availability of capital allocations for larger institutional buyers, to name a few. As a result, our historical pattern of seasonality may or may not continue to the same degree experienced in the prior years and may make it difficult to determine during the course of the year whether planned results will be achieved, and thus to adjust to changes in expectations.
A change in the tax laws relating to like-kind exchanges could adversely affect our business and the value of our stock.
Section 1031 of the Internal Revenue Code of 1986, as amended (the “Code”), provides for tax-free exchanges of real property for other real property. Legislation has been proposed on several occasions that would repeal or restrict the application of Section 1031. If tax-free exchanges under Section 1031 were to be limited or unavailable, our clients or prospective clients may decide not to purchase or sell property that they would have otherwise purchased or sold due to the tax consequences of the transaction, thus reducing the commissions we would have otherwise received. Any repeal or significant change in the tax rules pertaining to like-kind exchanges could have a substantial adverse impact on our business and the value of our stock.
A change in the tax laws could adversely affect our business and value of our stock.
The Code and state and local tax codes contain numerous provisions, regulations and interpretations. We operate in numerous states and cities in the United States and in Canada and are exposed to the risk of complying with those tax codes. Further, changes in tax laws in the various jurisdictions in which we operate may impact taxes we are required to pay and our ability to transact business in the jurisdictions. Further, such changes may make operating in these jurisdictions unprofitable and may unfavorably impact our results of operations and ability to execute our growth plans. The Trump administration and key members of Congress have made public statements indicating that tax reform is a priority for 2017. Certain changes to U.S. tax laws, such as changes in corporate tax rates could have an impact to our business, but the effects are unknown at this time.
In addition, changes in tax laws can impact investors’ perceived value of real estate, timing of transactions and perception of real estate as favorable investment. As a result, such changes may increase or decrease investors’ desire to engage in real estate transactions, which could have an unfavorable impact on our financial condition and results of operations.
21
The Internet could devalue our information services and lead to reduced client relationships, which could reduce the demand for our services.
The dynamic nature of the Internet, which has substantially increased the availability and transparency of information relating to commercial real estate listings and transactions, could change the way commercial real estate transactions are done. This has occurred to some extent in the residential real estate market as online brokerage and/or auction companies have eroded part of the market for traditional residential real estate brokerage firms. The proliferation of large amounts of data on the Internet could also devalue the information that we gather and disseminate as part of our business model and may harm certain aspects of our investment brokerage business in the event that principals of transactions prefer to transact directly with each other. The rapid dissemination and increasing transparency of information, particularly for public companies, increases the risks to our business that could result from negative media or announcements about ethics lapses or other operational problems, which could lead clients to terminate or reduce their relationships with us.
Our businesses, financial condition, results of operations and prospects could be adversely affected by new laws or regulations or by changes in existing laws or regulations or the application thereof. If we fail to comply with laws and regulations applicable to us, including in our role as a real estate broker or mortgage broker, we may incur significant financial penalties.
We are subject to numerous federal, state, local and foreign regulations specific to the services we perform in our business, as well as laws of broader applicability, such as tax, securities and employment laws. In general, the brokerage of real estate transactions requires us to maintain applicable licenses where we perform these services. If we fail to maintain our licenses or conduct these activities without a license, or violate any of the regulations covering our licenses, we may be required to pay fines (including treble damages in certain states) or return commissions received or have our licenses suspended or revoked. We could also be subject to disciplinary or other actions in the future due to claimed noncompliance with these regulations, which could have a material adverse effect on our operations and profitability.
Our business is also governed by various laws and regulations, limiting the manner in which prospective clients may be contacted, including federal and state “Do Not Call” and “Do Not Fax” regulations. We may be subject to legal claims and governmental action if we are perceived to be acting in violation of these laws and regulations. We may also be subject to claims to the extent individual employees or investment sales and financing professionals breach or fail to adhere to company policies and practices designed to maintain compliance with these laws and regulations. The penalties for violating these laws and regulations, can be material, and could result in changes in which we are able to contact prospective clients.
As the size and scope of commercial real estate transactions have increased significantly during the past several years, both the difficulty of ensuring compliance with numerous licensing regimes and the possible loss resulting from non-compliance have increased. New or revised legislation or regulations applicable to our business, both within and outside of the United States, as well as changes in administrations or enforcement priorities may have an adverse effect on our business. Such new or revised legislation or regulations applicable to our business may impact transaction volumes and values, increase the costs of compliance or prevent us from providing certain types of services in certain jurisdictions or in connection with certain transactions or clients. We are unable to predict how any of these new laws, rules, regulations and proposals will be implemented or in what form, or whether any additional or similar changes to laws or regulations, including the interpretation or implementation thereof, will occur in the future. Risks of legislative changes are inherent each time a new federal administration takes office, and the impact of any new or revised legislation or regulations under the Trump administration is unknown. Any such action could affect us in substantial and unpredictable ways and could have an adverse effect on our business, financial condition and results of operations.
22
Human Resource and Personnel Risks
If we are unable to attract and retain qualified and experienced managers, investment sales and financing professionals, our growth may be limited and our business and operating results could suffer.
Our most important asset is people, and our continued success is highly dependent upon the efforts of our managers and investment sales and financing professionals. If these managers or investment sales and financing professionals depart, we will lose the substantial time and resources we have invested in training and developing those individuals and our business, financial condition and results of operations may suffer. Additionally, such departures may have a disproportionate adverse effect on our operations if our most experienced investment sales and financing professionals do not remain with us or if departures occur in geographic areas where substantial amounts of our real estate brokerage commissions and financing fee revenues are generated.
Our competitors may attempt to recruit our investment sales and financing professionals or commission structures may change in the market place. For a variety of reasons, the exclusive independent contractor arrangements we have entered into or may enter into with sales professionals may not prevent these investment sales professionals from departing and competing against us or our commission compensation maybe relatively less attractive to our investment sales and financing professionals. We currently do not have employment agreements with most key employees, and there is no assurance that we will be able to retain their services.
An increasing component of our growth has also occurred through the recruiting, training and retention of key experienced investment sales and financing professionals. Any future growth through attracting these types of professionals will be partially dependent upon the continued availability of qualified candidates fitting the culture of our firm at reasonable terms and conditions. However, individuals whom we would like to recruit or retain may not agree to terms and conditions acceptable to us. In addition, the recruiting of new personnel involves risks that the persons acquired will not perform in accordance with expectations and that business judgments concerning the value, strengths and weaknesses of persons recruited will prove incorrect.
If we lose the services of our executive officers or certain other members of our senior management team, we may not be able to execute our business strategy.
Our success depends in a large part upon the continued service of our senior management team, who are important to our vision, strategic direction and culture. Our current long-term business strategy was developed in large part by our senior-level officers and depends in part on their skills and knowledge to implement, and also includes a focus on new growth and investment initiatives that may require additional management expertise to successfully execute our strategy. We may not be able to offset the impact on our business of the loss of the services of our senior management or other key officers or employees or be able to recruit additional or replacement talent.
Our business could be hurt if we are unable to retain our business philosophy and culture of information-sharing and efforts to retain our philosophy and culture could adversely affect our ability to maintain and grow our business.
Our policy of information-sharing, matching properties with large pools of investors and the emphasis that we place on our clients, our people and our culture defines our business philosophy and differentiates our services. Various factors could adversely affect this culture. If we do not continue to develop and implement the right processes and tools to manage our changing enterprise and maintain this culture, our ability to compete successfully and achieve our business objectives could be impaired, which could negatively impact our business, financial condition and results of operations.
The concentration of sales among our top investment sales and financing professionals could lead to losses if we are unable to retain them.
Our most successful investment sales and financing professionals are responsible for a significant percentage of our revenues. They also serve as mentors and role models, and provide invaluable training for
23
younger professionals, which is an integral part of our culture. This concentration among our top investment sales and financing professionals of real estate brokerage commissions and financing fees revenues can lead to greater and more concentrated risk of loss if we are unable to retain them, and could have a material adverse impact on our business and financial condition. Furthermore, many of our investment sales and financing professionals work in teams. If a team leader or manager leaves our Company, his or her team members may leave with the team leader.
Most of our sales professionals are independent contractors, not employees, and if laws, regulations or rulings mandate that they be employees, our business would be adversely impacted.
Most of our investment sales professionals are retained as independent contractors, and we are subject to the Internal Revenue Service regulations and applicable state law guidelines regarding independent contractor classification. These regulations and guidelines are subject to judicial and agency interpretation, and it could be determined that the independent contractor classification is inapplicable to some or all of our investment sales professionals. Further, if legal standards for classification of these investment sales professionals as independent contractors change or appear to be changing, it may be necessary to modify our compensation structure for these investment sales professionals in some or all of our markets, including paying additional compensation or reimbursing expenses. If we are forced to classify these investment sales professionals as employees, we would also become subject to laws regarding employee classification and compensation, and to claims regarding overtime, minimum wage, and meal and rest periods. We could also incur substantial costs, penalties and damages due to future challenges by current or former investment sales professionals to our classification or compensation practices. Any of these outcomes could result in substantial costs to us, could significantly impair our financial condition and our ability to conduct our business as we choose, and could damage our reputation and impair our ability to attract clients and investment sales and financing professionals.
Fraud, or theft, which is difficult to detect and deter, could harm us by impairing our ability to attract and retain clients and subjecting us to significant legal liability and reputational harm.
If our employees or investment sales and financing professionals engage in misconduct, our business could be adversely affected. It is not always possible to deter misconduct, and the precautions we take to deter and prevent this activity may not be effective in all cases. If our employees or investment sales and financing professionals were to engage in unethical business practices, improperly use, disseminate, fail to disseminate or disclose information provided by our clients, we could be subject to regulatory sanctions, suffer serious harm to our reputation, financial position and current client relationships and significantly impair our ability to attract future clients. These events could adversely affect our business, financial condition and results of operation. To the extent any fraud or theft of funds or misconduct result in losses that exceeds our insurance coverage, our business could be materially adversely affected.
Internal Business Risks
We may fail to successfully differentiate our brand from those of our competitors, which could adversely affect our revenues.
The value of our brand and reputation is one of our most important assets. An inherent risk in maintaining our brand is we may fail to successfully differentiate the scope and quality of our service and product offerings from those of our competitors, or we may fail to sufficiently innovate or develop improved products or services that will be attractive to our clients. Additionally, given the rigors of the competitive marketplace in which we operate, there is the risk we may not be able to continue to find ways to operate more productively and more cost-effectively, including by achieving economies of scale, or we will be limited in our ability to further reduce the costs required to operate on a nationally coordinated platform.
24
Our attempts to expand our services and businesses may not be successful and we may expend significant resources without corresponding returns.
We intend to expand our specialty groups, particularly multi-tenant retail, office, industrial and hospitality, as well as various niche segments, including multifamily tax credit, affordable housing, student housing, manufactured housing, seniors housing and self-storage. We also plan to grow our financing services provided through our subsidiary, Marcus & Millichap Capital Corporation. We expect to incur expenses relating to recruitment, training, and expanding our markets and services. The planned expansion of services and platforms requires significant resources, and there can be no assurance we will compete effectively, attract or train a sufficient number of professionals to support the expansion, or operate these businesses profitably. We may incur significant expenses for these plans without corresponding returns, which would harm our business, financial condition and results of operations.
If we experience significant growth in the future, such growth may be difficult to sustain and may place significant demands on our administrative, operational and financial resources.
If we experience significant growth in the future, such growth could place additional demands on our resources and increase our expenses, as we will have to commit additional management, operational and financial resources to maintain appropriate operational and financial systems to adequately support expansion. There can be no assurance we will be able to manage our expanding operations effectively or we will be able to maintain or accelerate our growth, and any failure to do so could adversely affect our ability to generate revenue and control our expenses, which could adversely affect our business, financial condition and results of operations. Moreover, we may have to delay, alter or eliminate the implementation of certain aspects of our growth strategy due to events beyond our control, including, but not limited to, changes in general economic conditions and commercial real estate market conditions. Such delays or changes to our growth strategy may adversely affect our business.
A majority of our revenue is derived from transaction fees, which are not long-term contracted sources of revenue and are subject to external economic conditions, and declines in those engagements could have a material adverse effect on our financial condition and results of operations.
We historically have earned principally all of our revenue from real estate brokerage transactions and financing fees. We expect that we will continue to rely heavily on revenue from real estate brokerage transactions and financing fees for substantially all of our revenue for the foreseeable future. A decline in number of transactions completed or in the value of the commercial real estate we sell could significantly decrease our revenues which would adversely affect our business, financial condition and results of operations.
If we are unable to retain existing clients and develop new clients, our financial condition may be adversely affected.
We are substantially dependent on long-term client relationships and on revenue received for services provided for them. Our listing agreements generally expire within six months and depend on the cooperation of the client during the pendency of the agreement, as is typical in the industry. In this competitive market, if we are unable to maintain these relationships or are otherwise unable to retain existing clients and develop new clients, our business, results of operations and/or financial condition may be materially adversely affected. Historically, a global economic downturn and weaknesses in the markets in which our clients and potential clients compete have led to a lower volume of transactions and fewer real estate clients generally, which makes it more difficult to maintain existing and establish new client relationships. These effects could increase again in the wake of the continuing political and economic uncertainties in the United States and in other countries.
25
If we do not respond to technological changes or upgrade our technology systems, our growth prospects and results of operations could be adversely affected.
To remain competitive, we must continue to enhance and improve the functionality, features and security of our technology infrastructure. Infrastructure upgrades may require significant capital investment outside of the normal course of business. In the future, we will likely need to improve and upgrade our technology, database systems and network infrastructure in order to allow our business to grow in both size and scope. Without such improvements, our operations might suffer from unanticipated system disruptions, slow performance or unreliable service levels, any of which could negatively affect our ability to provide rapid customer service. We may face significant delays in introducing new services, investment sales professional tools and enhancements. If competitors introduce new products and services using new technologies, our proprietary technology and systems may become less competitive, and our business may be harmed. In addition, the expansion and improvement of our systems and infrastructure may require us to commit substantial financial, operational and technical resources, with no assurance that our business will improve.
Interruption, unauthorized breaches, or failure of our information technology, communications systems or data services could hurt our ability to effectively provide our services, which could damage our reputation and harm our operating results.
Our business requires the continued operation of information technology and communication systems and network infrastructure. Our ability to conduct our national business may be adversely impacted by disruptions or breaches to these systems or infrastructure. Our information technology and communications systems are vulnerable to damage or disruption from fire, power loss, telecommunications failure, system malfunctions, computer viruses, third-party misconduct or penetration and criminal acts, natural disasters such as hurricanes, earthquakes and floods, acts of war or terrorism, or other events which are beyond our control. In addition, the operation and maintenance of these systems and networks is, in some cases, dependent on third-party technologies, systems and service providers for which there is no certainty of uninterrupted availability. Any of these events could cause system interruption, delays, and loss of critical data or intellectual property (such as our client lists and information, business methods and research) and may also disrupt our ability to provide services to or interact with our clients, and we may not be able to successfully implement contingency plans that depend on communication or travel. We have disaster recovery plans and backup systems to reduce the potentially adverse effect of such events, but our disaster recovery planning may not be sufficient and cannot account for all eventualities. A catastrophic event that results in the destruction or disruption of any of our data centers or our critical business or information technology systems could severely affect our ability to conduct normal business operations and, as a result, our future operating results could be adversely affected. Our business relies significantly on the use of commercial real estate data. We produce much of this data internally, but a significant portion is purchased from third-party providers for which there is no certainty of uninterrupted availability. A disruption of our ability to provide data to our professionals and/or clients could damage our reputation, and our operating results could be adversely affected.
Failure to maintain the security of our information and technology networks, including personally identifiable and client information could adversely affect us.
Security breaches and other disruptions could compromise our information and expose us to liability, which could cause our business and reputation to suffer. In the ordinary course of our business, we collect and store sensitive data, including our proprietary business information and intellectual property, and that of our clients and personally identifiable information of our employees and contractors, in our data centers and on our networks. The secure processing, maintenance and transmission of this information is critical to our operations. Despite our security measures, our information technology and infrastructure may be vulnerable to attacks by hackers or breached due to employee error, malfeasance or other disruptions. A significant actual or potential theft, loss, fraudulent use or misuse of client, employee or other personally identifiable data, whether by third parties or as a result of employee malfeasance or otherwise, non-compliance with our contractual or other legal
26
obligations regarding such data or a violation of our privacy and security policies with respect to such data could result in significant costs, fines, litigation or regulatory actions against us. Such an event could additionally disrupt our operations and the services we provide to clients, damage our reputation, and cause a loss of confidence in our services, which could adversely affect our business, revenues and competitive position. Additionally, we increasingly rely on third-party data storage providers, including cloud storage solution providers, resulting in less direct control over our data. Such third parties may also be vulnerable to security breaches and compromised security systems, which could adversely affect our reputation.
In addition, we rely on the collection and use of personally identifiable information from clients to conduct our business. We disclose our information collection and dissemination practices in a published privacy statement on our websites, which we may modify from time to time. We may be subject to legal claims, government action, including under the Racketeer Influenced and Corrupt Organizations Act (“RICO”), and damage to our reputation if we act or are perceived to be acting inconsistently with the terms of our privacy statement, client expectations or the law. In the event we or the vendors with which we contract to provide services on behalf of our clients were to suffer a breach of personally identifiable information, our customers could terminate their business with us. Further, we may be subject to claims to the extent individual employees or investment sales and financing professionals breach or fail to adhere to company policies and practices and such actions jeopardize any personally identifiable information. In addition, concern among potential buyers or sellers about our privacy practices could keep them from using our services or require us to incur significant expense to alter our business practices or educate them about how we use personally identifiable information.
Failure to appropriately deal with actual or perceived conflicts of interest could adversely affect our businesses.
Outside of our employees and investment sales and financing professionals, our reputation is one of our most important assets. As we have expanded the scope of our services, we increasingly have to address potential, actual or perceived conflicts of interest relating to the services we provide to our existing and potential clients. For example, conflicts may arise between our position as an advisor to both the buyer and seller in commercial real estate sales transactions or in instances when a potential buyer requests that we represent them in securing the necessary capital to acquire an asset we are selling for another client or when a capital source takes an adverse action against an owner client that we are advising in another matter. From time to time, we also advise or represent entities and parties affiliated with us in commercial real estate transactions which also involve clients unaffiliated with us. In this context, we may be subject to complaints or claims of a conflict of interest. While we believe we have attempted to adopt various policies, controls and procedures to address or limit actual or perceived conflicts, these policies and procedures may not be adequate or carry attendant costs and may not be adhered to by our employees. Appropriately dealing with conflicts of interest is complex and difficult and our reputation could be damaged and cause us to lose existing clients or fail to gain new clients if we fail, or appear to fail, to deal appropriately with conflicts of interest, which could have an adverse effect on our business, financial condition and results of operations.
If we acquire companies or recruit significant groups of personnel in the future, we may experience high transaction and integration costs, the integration process may be disruptive to our business and the acquired businesses and/or personnel may not perform as expected.
Our growth strategy may include the future acquisition of companies and/or recruitment of people and may involve significant transaction-related expenses. Transaction-related expenditures include severance costs, lease termination costs, transaction costs, deferred financing costs, possible regulatory costs and merger-related costs, among others. We may also experience difficulties in integrating operations and accounting systems acquired from other companies. These challenges include the diversion of management’s attention from the regular operations of our business and the potential loss of our key clients, our key associates or those of the acquired operations, each of which could harm our financial condition and results of operation. We believe some acquisitions could initially have an adverse impact on revenues, expenses, operating income and net income.
27
Acquisitions also frequently involve significant costs related to integrating people, information technology, accounting, reporting and management services and rationalizing personnel levels. If we are unable to fully integrate the accounting, reporting and other systems of the businesses we acquire, we may not be able to effectively manage them and our financial results may be materially affected. Moreover, the integration process itself may be disruptive to our business as it requires coordination of culture, people and geographically diverse organizations and implementation of new accounting and information technology systems.
In addition, acquisitions of businesses involve risks that the businesses acquired will not perform in accordance with expectations, that the expected synergies associated with acquisitions will not be achieved and that business judgments concerning the value, strengths and weaknesses of the people and the businesses acquired will prove incorrect, which could have an adverse effect on our business, financial condition and results of operations.
We may face significant liabilities and/or damage to our professional reputation as a result of litigation allegations and negative publicity.
As a licensed real estate broker, we and our licensed professionals and brokers are subject to regulatory due diligence, disclosure and standard-of-care obligations. The actual or perceived failure to fulfill these obligations could subject us or our professionals and brokers to litigation from parties who attempted to or in fact financed, purchased or sold properties that we or they brokered, managed or had some other involvement. We could become subject to claims by those who either wished to participate or did participate in real estate transactions alleging that we did not fulfill our regulatory, contractual or other legal obligations. We also face potential conflicts of interest claims when we represent both the buyer and the seller in a transaction.
We depend on our business relationships and our reputation for integrity and high-caliber professional services to attract and retain clients. As a result, allegations by private litigants or regulators, whether the ultimate outcome is favorable or unfavorable to us, as well as negative publicity and press speculation about us or our investment activities, whether or not valid, may harm our reputation and damage our business prospects. In addition, if any lawsuits were brought against us and resulted in a finding of substantial legal liability, it could materially, adversely affect our business, financial condition or results of operations or cause significant reputational harm to us, which could materially impact our business.
Some of these litigation risks may be mitigated by the commercial insurance we maintain in amounts we believe are appropriate. However, in the event of a substantial loss, our commercial insurance coverage and/or self-insurance reserve levels might not be sufficient to pay the full damages, or the scope of available coverage may not cover certain types of claims. Further, the value of otherwise valid claims we hold under insurance policies could become uncollectible in the event of the covering insurance company’s insolvency, although we seek to limit this risk by placing our commercial insurance only with highly-rated companies. Any of these events could negatively impact our business, financial condition or results of operations.
We are an “emerging growth company,” and any decision on our part to comply only with certain reduced reporting and disclosure requirements applicable to emerging growth companies could make our common stock less attractive to investors.
We are an “emerging growth company,” as defined in the JOBS Act, and for as long as we continue to be an “emerging growth company,” we may choose to take advantage of exemptions from various reporting requirements applicable to other public companies but not to “emerging growth companies,” including, but not limited to; (i) not being required to have our independent registered public accounting firm audit our internal control over financial reporting under Section 404 of the Sarbanes-Oxley Act, which may increase the risk that weaknesses or deficiencies in the internal control over financial reporting go undetected; (ii) reduced disclosure obligations regarding executive compensation in our periodic reports and proxy statements, which may make it more difficult for investors and securities analysts to evaluate our company; and (iii) exemptions from the
28
requirements of holding a nonbinding advisory vote on executive compensation and stockholder approval of any golden parachute payments not previously approved.
We could remain an “emerging growth company” for up to five years, although if the market value of our common stock that is held by non-affiliates exceeds $700 million as of any June 30 before that time, we would cease to be an “emerging growth company” as of the following December 31. We cannot predict if investors will find our common stock less attractive if we choose to rely on these exemptions. If some investors find our common stock less attractive as a result of any choices to reduce future disclosure, there may be a less active trading market for our common stock and our stock price may be more volatile.
We have irrevocably elected to opt out of the extended transition period for complying with new or revised accounting standards pursuant to Section 107(b) of the JOBS Act, and therefore, we are subject to the same new or revised accounting standards as other public companies that are not “emerging growth companies.”
We are obligated to develop and maintain proper and effective internal control over financial reporting. These internal controls may or may not be subject to auditor attestation, which may adversely affect investor confidence in our Company and, as a result, the value of our common stock.
We are required, pursuant to Section 404 of the Sarbanes-Oxley Act of 2002, to furnish a report by management on, among other things, the effectiveness of our internal control over financial reporting. This assessment includes disclosure of any material weaknesses identified by our management in our internal control over financial reporting.
We are required to disclose changes made in our internal control and procedures on a quarterly basis. However, our independent registered public accounting firm will not be required to formally attest to the effectiveness of our internal control over financial reporting pursuant to Section 404 until the date we are no longer an “emerging growth company,” as defined in the JOBS Act. At such time, our independent registered public accounting firm may issue a report that is adverse in the event it is not satisfied with the level at which our controls are documented, designed or operating. Our remediation efforts may not enable us to avoid a material weakness in the future. In addition, to comply with the requirements of being a public company, we may need to undertake various actions, such as implementing new internal controls and procedures and hiring additional accounting or internal audit staff.
Our investments in marketable securities are subject to certain risks which could affect our overall financial condition, results of operations or cash flows.
We invest a portion of our available cash and cash equivalent balances in money market funds, some of which have floating net asset values or by purchasing marketable securities with maturities in excess of three months in a managed portfolio in a variety of fixed and variable rate debt securities, including U.S. government and federal agency securities and corporate debt securities. The primary objective of our investment activity is to maintain the safety of principal, provide for future liquidity requirements while maximizing yields without significantly increasing risk. Should any of our investments or marketable securities lose value or have their liquidity impaired, it could affect the Company’s overall financial condition. Additionally, should we choose to sell these securities in the future, our consolidated operating results or cash flows may be affected.
We may be deemed to be an investment company due to our investments in marketable securities and, if such a determination were made, we would become subject to significant regulation that would adversely affect our business.
We may be deemed to be an investment company under the Investment Company Act of 1940 if, among other things, we own “investment securities” with a value exceeding 40% of the value of our total assets, unless we qualify under a particular exemption or safe harbor. We invest part of our available cash and cash equivalents
29
in variety of short-term, investment grade securities, some of which may qualify as “investment securities” under the Investment Company Act. Investment companies are subject to registration under the Investment Company Act and compliance with a variety of restrictions and requirements. If we were to be deemed an investment company we would become subject to these restrictions and requirements, and the consequences of having been an investment company without registering under the Investment Company Act could have a material adverse effect on our business, financial condition and results of operations, as well as restrict our ability to sell and issue securities, borrow funds, engage in various transactions or other activities and make certain investment decisions. In addition, we may incur significant costs or limitation business opportunities to avoid investment company status if an exemption from the Investment Company Act were to be considered unavailable to us at a time when the value of our “investment securities” exceeds 40% of the value of our total assets. We believe that we satisfy the conditions to be exempt from the Investment Company Act because, among other things, we are engaged directly and primarily in a business other than that of investing, reinvesting, owning, holding or trading in securities. However, absent an exemptive order from the SEC, our status of being exempt cannot be assured.
Risks related to the Ownership of Our Common Stock
Our Co-Chairman and founder controls a significant interest in our stock, and the concentrated ownership of our common stock may prevent other stockholders from influencing significant decisions.
George M. Marcus, our Co-Chairman and founder beneficially owns approximately 55% of our outstanding common stock as of December 31, 2016. Because Mr. Marcus controls a majority of the voting power of our outstanding common stock, he is able to determine the outcome of corporate actions requiring stockholder approval, including the election and removal of directors, so long as he controls a significant portion of our common stock.
The price of our common stock may fluctuate significantly and you could lose all or part of your investment.
Volatility in the market price of our common stock may prevent shareholders from being able to sell shares of our common stock at or above the price shareholders paid for them. The market price for our common stock could fluctuate significantly for various reasons, including quarterly and annual variations in our results and those of our competitors; changes to the competitive landscape; estimates and projections by the investment community; the arrival or departure of key personnel, especially the retirement or departure of key senior investment sales and financing professionals and management; the introduction of new services by us or our competitors; acquisitions, strategic alliances or joint ventures involving us or our competitors; and general global and domestic economic, credit and liquidity issues, market or political conditions. For example, in 2015 and 2016, the price of our shares has ranged from a high of $53.92 per share to a low of $18.77.
As a result of these factors, investors in our common stock may not be able to resell their shares at or above the price paid to acquire the stock or may not be able to resell them at all. These broad market and industry factors may materially reduce the market price of our common stock, regardless of our operating performance. In addition, price volatility may be greater if the public float and trading volume of our common stock is low.
If our Co-Chairman sells a controlling interest in our Company to a third party in a private transaction, you may not realize any change-of-control premium on shares of our common stock and we may become subject to the control of a presently unknown third party.
Our Co-Chairman and controlling stockholder has the ability, should he choose to do so, to sell some or all of the shares of our common stock that he controls in a private transaction, which, if sufficient in size, could result in a change of control of our Company. The ability of our Co-Chairman and controlling stockholder to privately sell the shares of our common stock that he controls, with no requirement for a concurrent offer to be made to acquire all of our common stock that will be publicly traded hereafter, could prevent shareholders from realizing any change-of-control premium on shares of our common stock that may otherwise accrue to entities
30
controlled by our Co-Chairman on a private sale of our common stock. If entities controlled by our Co-Chairman privately sell a significant equity interest in our Company, we may become subject to the control of a presently unknown third party. Such third party may have conflicts of interest with those of other stockholders. Furthermore, if our Co-Chairman sells a controlling interest in our Company to a third party, our commercial agreements and relationships could be impacted, all of which may adversely affect our ability to run our business as described herein and may have a material adverse effect on our operating results and financial condition.
Two of our directors may have actual or potential conflicts of interest because of their positions with MMC.
George M. Marcus and William A. Millichap serve as co-chairmen of our board of directors and are also directors of MMC. In addition, Mr. Marcus beneficially owns most of the outstanding stock of MMC. Their position at MMC and the ownership of any MMC equity or equity awards creates, or may create the appearance of, conflicts of interest when these directors are faced with decisions that could have different implications for MMC than the decisions have for us.
If securities analysts do not publish research or reports about our business or if they downgrade our Company or our sector, or we do not meet expectations of the analysts the price of our common stock could decline.
The trading market for our common stock depends in part on the research and reports that industry or financial analysts publish about us or our business. These research reports about our business may contain information about the Company, including but not limited to estimates of our future results of operations and stock price. We do not control these analysts, nor can we assure that any analysts will continue to follow us, issue research reports or publish information that accurately predicts our actual results or stock price. Furthermore, if we do not meet the expectations of industry or financial analysts or one or more of the analysts who do cover us downgrades our Company or our industry, or the stock of any of our competitors, the price of our common stock could decline. If one or more of these analysts ceases coverage of our Company, we could lose visibility in the market, which in turn could cause the price of our common stock to decline.
Significant fluctuations in our revenues and net income may make it difficult for us to achieve steady earnings growth on a quarterly or an annual basis, which may make the comparison between periods difficult and may cause the price of our common stock to decline.
We have experienced and may continue to experience fluctuations in revenues and net income as a result of many factors, including, but not limited to, economic conditions, capital market disruptions, the timing of transactions, revenue mix and the timing of additional selling, general and administrative expenses to support growth initiatives. We provide many of our services pursuant to contracts that typically expire within six months and that are dependent on the client’s cooperation. Consequently, many of our clients can terminate or significantly reduce their relationships with us on very short notice for any reason.
We plan our capital and operating expenditures based on our expectations of future revenues and, if revenues are below expectations in any given quarter or year, we may be unable to adjust capital or operating expenditures in a timely manner to compensate for any unexpected revenue shortfall, which could have an immediate material adverse effect on our business, financial condition and results of operation.
Future sales or the perception of future sales of a substantial amount of our common stock may depress the price of shares of our common stock.
As of December 31, 2016, there were approximately 22.4 million shares of our common stock outstanding, which could be registered and sold in a private or public sale. The majority of these shares are beneficially owned by entities controlled by George M. Marcus our Co-Chairman. Future sales, the lifting of common stock resale restrictions that will expire over the next two years, issuances of shares under our 2013 Omnibus Equity Incentive Plan and 2013 Employee Stock Purchase Plan or the availability of a substantial amount of our
31
common stock in the public market could adversely affect the prevailing market price of our common stock and could impair our ability to raise capital through the future sales of equity securities.
We may issue shares of our common stock or other securities from time to time as consideration for future acquisitions and investments. If any such acquisition or investment is significant, the number of shares of our common stock, or the number or aggregate principal amount, as the case may be, of other securities that we may issue may in turn be substantial. We may also grant registration rights covering those shares of our common stock or other securities in connection with any such acquisitions and investments.
We cannot predict the size of future issuances or sales of our common stock or the effect, if any, that future issuances and sales of our common stock will have on the market price of our common stock. Sales of substantial amounts of our common stock (including shares of our common stock issued in connection with an acquisition), or the perception that such sales could occur, may adversely affect prevailing market prices for our common stock.
Item 1B. Unresolved Staff Comments
Not applicable.
Our principal executive offices are located at 23975 Park Sorrento, Suite 400, Calabasas, California 91302 where our telephone number is (818) 212-2250. We lease approximately 28,577 (net of sublease) square feet, under a lease that expires in December 2021 for our executive offices in Calabasas, California. We also lease all of our 82 brokerage offices (typically less than 12,000 square feet) and other support facilities in United States and Canada aggregating 529,984 square feet, primarily for our investment sales and financing professionals and support personnel. We believe that our current facilities are adequate to meet our needs through the end of 2017; however, as we continue to expand in various midmarket locations and grow our market share in existing metropolitan areas, we may need to lease additional space.
We are involved in claims and legal actions arising in the ordinary course of our business, some of which involve claims for damages that are substantial in amount. Most of these litigation matters are covered by insurance which contain deductibles, exclusions, claim limits and aggregate policy limits. Such litigation and other proceedings may include, but are not limited to, actions relating to commercial relationships, standard brokerage disputes like the alleged failure to disclose physical or environmental defects or property expenses or contracts, the alleged inadequate disclosure of matters relating to the transaction like the relationships among the parties to the transaction, potential claims or losses pertaining to the asset, vicarious liability based upon conduct of individuals or entities outside of our control, general fraud claims, conflicts of interest claims, employment law claims, including claims challenging the classification of our sales professionals as independent contractors, claims alleging violations of state consumer fraud statutes and intellectual property. While the ultimate liability for these legal proceeding cannot be determined, we review the need for our accrual for loss contingencies quarterly and records an accrual for litigation related losses where the likelihood of loss is both probable and estimable. We do not believe, based on information currently available to us, that the final outcome of these proceedings will have a material adverse effect on our consolidated financial position, results of operations or cash flows.
For information on our legal proceedings, see Note 14 – “Commitments and Contingencies” of our accompanying Notes to Consolidated Financial Statements included in Part II, Item 8, “Financial Statements and Supplementary Data” of this Annual Report on Form 10-K.
Item 4. Mine Safety Disclosures
Not applicable.
32
Item 5. Market for Registrant’s Common Equity, Related Stockholder Matters and Issuer Purchases of Equity Securities
Market Information
Our common stock has traded on the New York Stock Exchange (“NYSE”) under the symbol “MMI” since October 31, 2013. Prior to that time, there was no public market for our stock. The following table sets forth for the indicated period the high and low intra-day sales prices per share for our common stock on the NYSE.
| High | Low | |||||||
| 2015: |
||||||||
| First quarter |
$ | 39.92 | $ | 30.89 | ||||
| Second quarter |
$ | 49.88 | $ | 35.10 | ||||
| Third quarter |
$ | 53.92 | $ | 40.59 | ||||
| Fourth quarter |
$ | 49.97 | $ | 28.38 | ||||
| 2016: |
||||||||
| First quarter |
$ | 28.34 | $ | 18.77 | ||||
| Second quarter |
$ | 27.73 | $ | 23.60 | ||||
| Third quarter |
$ | 28.99 | $ | 24.35 | ||||
| Fourth quarter |
$ | 30.31 | $ | 22.93 | ||||
As of March 2, 2017, there were 24 stockholders of record, and the closing price of our common stock was $27.14 per share as reported on the NYSE.
Dividends
We do not pay a regular dividend. We may evaluate our dividend policy in the future. Any declaration and payment of future dividends to holders of our common stock will be at the discretion of the board of directors and will depend on many factors, including our financial condition, earnings, cash flows, capital requirements, level of indebtedness, statutory and contractual restrictions applicable to the payment of dividends and other considerations that our board of directors deems relevant.
Stock Performance Graph
The performance graph shall not be deemed “filed” for purposes of Section 18 of the Exchange Act, or otherwise subject to the liabilities under that Section and shall not be deemed to be incorporated by reference into any filing of Marcus & Millichap, Inc. under the Securities Act of 1933, as amended (the “Securities Act”), or the Exchange Act.
The following graph shows a comparison from October 31, 2013 through December 31, 2016 of the cumulative total return for our common stock, the Standard & Poor’s 500 Stock Index (“S&P 500 Index”) and an industry peer group for this period. The industry peer group is comprised of the following publicly-traded real estate services companies: CBRE Group, Inc., Jones Lang LaSalle Incorporated and HFF, Inc. (collectively “Peer Group”). These three companies represent our primary competitors that are publicly traded with certain business lines reasonably comparable to ours. The graph assumes that $100 was invested at the market close on October 31, 2013 in the common stock of Marcus & Millichap Inc., the S&P 500 Index and the Peer Group assumes reinvestments of dividends. The stock price performance of the following graph is not necessarily indicative of future stock price performance.
33
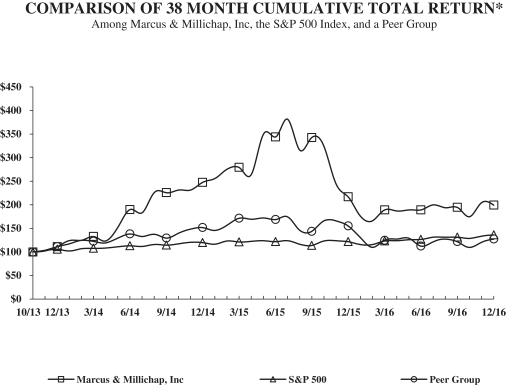
| Jan. | Feb. | Mar. | Apr. | May. | Jun. | Jul. | Aug. | Sep. | Oct. | Nov. | Dec. | |||||||||||||||||||||||||||||||||||||
| 2013: |
||||||||||||||||||||||||||||||||||||||||||||||||
| Marcus & Millichap, Inc. |
— | — | — | — | — | — | — | — | — | 100.00 | 102.24 | 111.03 | ||||||||||||||||||||||||||||||||||||
| S&P 500 |
— | — | — | — | — | — | — | — | — | 100.00 | 103.05 | 105.66 | ||||||||||||||||||||||||||||||||||||
| Peer Group |
— | — | — | — | — | — | — | — | — | 100.00 | 103.87 | 111.20 | ||||||||||||||||||||||||||||||||||||
| 2014: |
||||||||||||||||||||||||||||||||||||||||||||||||
| Marcus & Millichap, Inc. |
124.22 | 124.96 | 132.94 | 123.17 | 151.64 | 190.09 | 183.08 | 225.93 | 225.48 | 231.45 | 231.22 | 247.76 | ||||||||||||||||||||||||||||||||||||
| S&P 500 |
102.00 | 106.67 | 107.57 | 108.36 | 110.90 | 113.20 | 111.63 | 116.10 | 114.47 | 117.27 | 120.42 | 120.12 | ||||||||||||||||||||||||||||||||||||
| Peer Group |
117.29 | 124.73 | 122.25 | 119.40 | 129.18 | 138.10 | 133.10 | 137.82 | 129.69 | 139.39 | 148.52 | 151.75 | ||||||||||||||||||||||||||||||||||||
| 2015: |
||||||||||||||||||||||||||||||||||||||||||||||||
| Marcus & Millichap, Inc. |
255.44 | 275.19 | 279.28 | 263.64 | 349.55 | 343.82 | 381.82 | 316.39 | 342.70 | 324.66 | 244.49 | 217.14 | ||||||||||||||||||||||||||||||||||||
| S&P 500 |
116.51 | 123.21 | 121.26 | 122.42 | 124.00 | 121.60 | 124.15 | 116.66 | 113.77 | 123.37 | 123.73 | 121.78 | ||||||||||||||||||||||||||||||||||||
| Peer Group |
145.75 | 156.19 | 171.56 | 169.56 | 172.22 | 168.65 | 174.86 | 146.33 | 143.72 | 165.74 | 166.09 | 155.39 | ||||||||||||||||||||||||||||||||||||
| 2016: |
||||||||||||||||||||||||||||||||||||||||||||||||
| Marcus & Millichap, Inc. |
176.15 | 166.10 | 189.20 | 186.89 | 189.42 | 189.34 | 199.63 | 194.11 | 194.86 | 174.59 | 204.55 | 199.11 | ||||||||||||||||||||||||||||||||||||
| S&P 500 |
115.74 | 115.58 | 123.42 | 123.90 | 126.13 | 126.45 | 131.12 | 131.30 | 131.32 | 128.93 | 133.70 | 136.35 | ||||||||||||||||||||||||||||||||||||
| Peer Group |
130.71 | 109.93 | 124.97 | 127.61 | 129.36 | 112.35 | 121.55 | 127.47 | 121.68 | 109.58 | 120.57 | 127.29 | ||||||||||||||||||||||||||||||||||||
Recent Sales of Unregistered Securities
None.
Purchases of Equity Securities
None.
34
Item 6. Selected Financial Data
The following selected consolidated financial and other data should be read in conjunction with Part II, Item 7, “Management’s Discussion and Analysis of Financial Condition and Results of Operations,” and our consolidated financial statements and the related notes included in Part II, Item 8, “Financial Statements and Supplementary Data” of this Annual Report on Form 10-K.
The following table presents the consolidated statements of income data for the years ended December 31, 2016, 2015 and 2014, and the consolidated balance sheets data at December 31, 2016 and 2015. Such financial data are derived from our audited consolidated financial statements included elsewhere in this Annual Report on Form 10-K. The table also presents the consolidated statements of income data for the years ended December 31, 2013 and 2012 and the consolidated balance sheets data at December 31, 2014, 2013 and 2012, which are derived from our audited consolidated financial statements that are not included in this Annual Report on Form 10-K. Our historical results are not necessarily indicative of our results in any future period.
| Year Ended December 31, | ||||||||||||||||||||
| 2016 | 2015 | 2014 | 2013 | 2012 | ||||||||||||||||
| (in thousands except per share, investment sales and financing professional and sales volume amounts) |
||||||||||||||||||||
| Statement of Income Data: |
||||||||||||||||||||
| Total revenues |
$ | 717,450 | $ | 689,055 | $ | 572,188 | $ | 435,895 | $ | 385,716 | ||||||||||
| Cost of services |
444,768 | 423,389 | 350,102 | 264,637 | 230,248 | |||||||||||||||
| Stock-based and other compensation in connection with IPO (1) |
— | — | — | 31,268 | — | |||||||||||||||
| Operating income |
106,501 | 114,651 | 84,606 | 21,286 | 49,008 | |||||||||||||||
| Provision for income taxes (2) |
42,445 | 47,018 | 33,452 | 13,735 | 21,507 | |||||||||||||||
|
|
|
|
|
|
|
|
|
|
|
|||||||||||
| Net income |
$ | 64,657 | $ | 66,350 | $ | 49,531 | $ | 8,206 | $ | 27,934 | ||||||||||
| Less: Net (loss) income attributable to Marcus & Millichap Real Estate Investment Services, Inc. prior to initial public offering on October 31, 2013 |
— | — | — | (1,045 | ) | 27,934 | ||||||||||||||
|
|
|
|
|
|
|
|
|
|
|
|||||||||||
| Net income attributable to Marcus & Millichap, Inc. subsequent to initial public offering |
$ | 64,657 | $ | 66,350 | $ | 49,531 | $ | 9,251 | $ | — | ||||||||||
|
|
|
|
|
|
|
|
|
|
|
|||||||||||
| Earnings per share (3): |
||||||||||||||||||||
| Basic |
$ | 1.66 | $ | 1.71 | $ | 1.27 | $ | 0.24 | ||||||||||||
| Diluted |
$ | 1.66 | $ | 1.69 | $ | 1.27 | $ | 0.24 | ||||||||||||
| Weighted average common shares outstanding (3): |
||||||||||||||||||||
| Basic |
38,899 | 38,848 | 38,851 | 38,787 | ||||||||||||||||
| Diluted |
39,035 | 39,162 | 38,978 | 38,815 | ||||||||||||||||
| Balance Sheet Data: |
||||||||||||||||||||
| Cash and cash equivalents |
$ | 187,371 | $ | 96,185 | $ | 149,159 | $ | 100,952 | $ | 3,107 | ||||||||||
| Marketable securities, available-for-sale (4) |
$ | 104,929 | $ | 134,255 | $ | 14,752 | $ | — | $ | — | ||||||||||
| Total assets |
$ | 394,016 | $ | 321,225 | $ | 233,604 | $ | 167,309 | $ | 89,733 | ||||||||||
| Long-term liabilities |
$ | 56,986 | $ | 57,224 | $ | 49,591 | $ | 48,052 | $ | 13,650 | ||||||||||
| Total liabilities |
$ | 135,162 | $ | 132,235 | $ | 116,795 | $ | 104,812 | $ | 68,103 | ||||||||||
| Total stockholders’ equity |
$ | 258,854 | $ | 188,990 | $ | 116,809 | $ | 62,497 | $ | 21,630 | ||||||||||
| Other Data: |
||||||||||||||||||||
| Adjusted EBITDA (5) |
$ | 118,296 | $ | 124,140 | $ | 92,824 | $ | 61,286 | $ | 59,708 | ||||||||||
| Investment sales and financing professionals |
1,737 | 1,607 | 1,494 | 1,313 | 1,066 | |||||||||||||||
| Sales volume (dollars in millions) |
$ | 42,312 | $ | 37,847 | $ | 33,139 | $ | 23,975 | $ | 22,014 | ||||||||||
35
| (1) | Consists of non-cash stock based compensation and other compensation charges incurred in connection with our IPO. |
| (2) | Prior to the IPO in October 2013, we were subject to a tax-sharing agreement whereby we provided for income taxes using an effective tax rate of 43.5%. As part of the IPO, the tax-sharing agreement with MMC was terminated. |
| (3) | Earnings per share information has not been presented for periods prior to the IPO as amounts were not meaningful. |
| (4) | Includes both short-term and long-term marketable securities, available-for-sale. |
| (5) | Adjusted EBITDA is not a measurement of our financial performance under U.S. GAAP and should not be considered as an alternative to net income, operating income or any other measures derived in accordance with U.S. GAAP. For a definition of Adjusted EBITDA and a reconciliation of Adjusted EBITDA to net income, see “Item 7, Management’s Discussion and Analysis of Financial Condition and Results of Operations – Non-GAAP Financial Measure. |
36
ITEM 7. MANAGEMENT’S DISCUSSION AND ANALYSIS OF FINANCIAL CONDITION AND RESULTS OF OPERATIONS
The following discussion of our financial condition and results of operations should be read in conjunction with our audited consolidated financial statements and the accompanying notes thereto included elsewhere herein. The following discussion contains, in addition to historical information, forward-looking statements that include risks and uncertainties. Our actual results may differ materially from those anticipated in these forward-looking statements as a result of certain factors, including those factors set forth under Item 1A – “Risk Factors” of this Annual Report on Form 10-K.
Overview
Our Business
We are a leading national brokerage firm specializing in commercial real estate investment sales, financing, research and advisory services. We have been the top commercial real estate investment broker in the United States based on the number of investment transactions over the last 10 years. As of December 31, 2016, we had over 1,700 investment sales and financing professionals operating in 82 offices who provide real estate brokerage and financing services to sellers and buyers of commercial real estate. We also offer market research, consulting and advisory services to our clients. During the year ended December 31, 2016, we closed 8,995 sales, financing and other transactions with total volume of approximately $42.3 billion, an increase from 8,715 sales, financing and other transactions with total volume of approximately $37.8 billion in 2015.
We generate revenues by collecting real estate brokerage commissions upon the sale, and fees upon the financing of, commercial properties and by providing consulting and advisory services. Real estate brokerage commissions are typically based upon the value of the property, and financing fees are typically based upon the size of the loan. During the year ended December 31, 2016, approximately 92% of our revenues were generated from real estate brokerage commissions, 6% from financing fees and 2% from other revenues, including consulting and advisory services.
Factors Affecting Our Business
Our business and our operating results, financial condition and liquidity are significantly affected by the number and size of commercial real estate investment sales and financing transactions we close in any period. The number and size of these transactions are affected by both internal and external factors. Internally, we are affected by our ability to recruit and retain investment sales and financing professionals, identify and contract properties for sale and properties that need financing and refinancing. Externally we are affected by four main factors including the economy, commercial real estate supply and demand, capital markets and investment activity.
The Economy
Our business is dependent on economic conditions within the markets in which we operate. Changes in the economy on a global, national, regional or local basis can have a positive or a negative impact on our business. Economic indicators and projections related to job growth, unemployment, interest rates, construction and vacancies can have a positive or a negative impact on our business. Overall market conditions can have an effect on investor sentiment and, ultimately, the demand for our services from investors in real estate. Our national footprint allows us to support our clients in balancing the opportunities and risks of changing regional economic conditions. We believe the U.S. economy is showing durability and growth. The U.S. saw continued moderate growth, favorable unemployment levels and strengthened wage growth during 2016. Sentiment about economic expansion in 2017 has recently become more favorable as seen in the recent rise in the stock market, U.S. Federal Reserve interest rate increases and the possible impact of policies of the Trump administration.
37
Commercial Real Estate Supply and Demand
Our business is dependent on the willingness of investors to invest in or sell commercial real estate, which is affected by factors beyond our control. These factors include the supply of commercial real estate coupled with user demand for these properties and the performance of real estate assets when compared with other investments alternatives, such as stocks and bonds. Despite the economic recovery over the past eight years, we believe an investment in real estate continues to be a compelling investment for investors as real estate fundamentals generally remain balanced. The moderate economic growth has generated demand and reasonable construction levels for most property types has been the basis of the longevity and durability of the current real estate cycle. We believe the maturing cycle, combined with the current uncertainty around forecasted growth, rising inflation, higher interest rate trends have required investors and lenders to recalibrate their underwriting assumptions in the short-term and have resulted in a slowdown in sales. Furthermore, many investors are delaying transactions in anticipation of more clarity regarding tax reform, regulatory easing and economic initiatives. We believe a positive boost to investor sentiment is possible with clarity on government policies and growth initiatives. We believe that these factors should continue to support long-term commercial real estate investor demand and, therefore, demand for our brokerage and financing services.
Capital Markets
Credit and liquidity issues in the financial markets have a direct impact on the flow of capital to the commercial real estate market. Real estate purchases are often financed with debt and, as a result, credit and liquidity impact transaction activity and prices. Changes in interest rates, as well as steady and protracted movements of interest rates in one direction, whether interest rates increase or decrease, could adversely or positively affect the operations and income potential of commercial real estate properties. These changes also influence the demand of investors for commercial real estate investments. We believe indications from the U.S. Federal Reserve of future rate increases, the uncertainty as to the impact of new fiscal policies and the recent sharp increase in longer term interest rates has created a short-term headwind for real estate transactions. We continue to see disciplined underwriting from lenders as well as ample liquidity in the market. However, we have seen transactions taking longer to close in late 2016 or transactions being delayed or renegotiated due to market conditions.
Investment Activity
We rely on investors to buy and sell properties in order generate commissions. Investors’ desires to engage in real estate transactions are dependent on many factors that are beyond our control. The economy, supply and demand for properly positioned properties, available credit and market events impact investor sentiment and, therefore, transaction velocity. In addition, our private clients are often motivated to buy, sell and/or refinance properties due to personal circumstances such as death, divorce, partnership breakups and estate planning. We believe that we are in a maturing real estate cycle. In 2016, the sales transaction market declined after several years of robust recovery, which combined with rising interest rates is hampering sales activity. At the same time, many investors have signaled a wait-and-see attitude toward investment decisions in anticipation of the Trump administration’s tax reform, regulatory easing and infrastructure initiatives as the timing and scope are unclear but once passed into law are likely to be supportive of economic expansion and real estate markets. We believe that the healthy property fundamentals and lack of over-leveraging during the past several years support an active, but more tempered, market environment.
Seasonality
Our real estate brokerage commissions and financing fees have tended to be seasonal and, combined with other factors, can affect an investor’s ability to compare our financial condition and results of operations on a quarter-by-quarter basis. Historically, this seasonality has generally caused our revenue, operating income, net income and cash flows from operating activities to be lower in the first half of the year and higher in the second half of the year, particularly in the fourth quarter. The concentration of earnings and cash flows in the last six
38
months of the year, particularly in the fourth quarter, is due to an industry-wide focus of clients to complete transactions towards the end of the calendar year. This historical trend can be disrupted both positively and negatively by major economic or political events impacting investor sentiment for a particular property type or location, volatility in financial markets, current and future projections of interest rates, attractiveness of other asset classes, market liquidity and the extent of limitations or availability of capital allocations for larger property buyers, among others. Private client investors may accelerate or delay transactions due to personal or business related reasons unrelated to economic events. In addition, our operating margins are typically lower during the second half of each year due to our commission structure for some of our senior investment sales and financing professionals. These senior investment sales and financing professionals are on a graduated commission schedule that resets annually in which higher commissions are paid for higher sales volumes. Our historical pattern of seasonality may or may not continue to the same degree experienced in prior years.
Operating Segments
We follow the guidance for segment reporting, which requires reporting information on operating segments in interim and annual financial statements. An operating segment is defined as a component of an enterprise that engages in business activities from which it may earn revenues and incur expenses whose separate financial information is available and is evaluated regularly by the Chief Operating Decision Maker (“CODM”) or decision making group, to perform resource allocations and performance assessments. The CODMs are the Chief Executive Officer, Chief Operating Officer and Chief Financial Officer. The CODMs review aggregated financial information presented on an office-by-office basis for purposes of making operating decisions, assessing financial performance and allocating resources. Based on the evaluation of our financial information, management believes that the Company’s offices represent individual operating segments with similar economic characteristics that meet the criteria for aggregation into a single reportable segment for financial reporting purposes.
Key Financial Measures and Indicators
Revenues
Our revenues are primarily generated from our real estate investment sales business. In addition to real estate brokerage commissions, we generate revenues from financing fees and from other revenues, which are primarily comprised of consulting and advisory fees.
Our business is transaction oriented and, as such, we rely on investment sales and financing professionals to continually develop leads, identify properties to sell, market those properties and close sales in a timely manner to generate a consistent flow of revenue. While our sales volume is impacted by the seasonality factors discussed above, the timing of closings is also dependent on many market and personal factors unique to a particular client or transaction, particularly clients transacting in the $1-$10 million private client market segment. These factors can cause transactions to be accelerated or delayed beyond our control. Further, commission rates earned are generally inversely related to the value of the property sold. As a result of our expansion into the middle and larger transaction market segments, we have seen our overall commission rates fluctuate from period-to-period as a result of changes in the relative mix of the number and volume of transactions closed in the middle and larger transaction market segments as compared to the $1-$10 million private client market segment. These factors may result in period-to-period variations in our revenues different from historical patterns.
A small percentage of our transactions include retainer fees and/or breakage fees. Retainer fees are credited against a success-based fee upon the closing of a transaction or a breakage fee. Transactions that are terminated before completion will sometimes generate breakage fees, which are usually calculated as a set amount or a percentage of the fee that we would have received had the transaction closed.
Real estate brokerage commissions
We earn real estate brokerage commissions by acting as a broker for commercial real estate owners seeking to sell or investors seeking to buy properties. Revenues from real estate brokerage commissions are typically recognized at the close of escrow.
39
Financing fees
We earn financing fees by securing financing on purchase transactions or by securing refinancing of our clients’ existing mortgage debt. We recognize financing fee revenues at the time the loan closes and we have no remaining significant obligations for performance in connection with the transaction. To a lesser extent, we also earn ancillary fees associated with financing activities.
Other revenues
Other revenues include fees generated from consulting and advisory services performed by our investment sales professionals, as well as referral fees from other real estate brokers. Revenues from these services are recognized as they are performed and completed.
Operating Expenses
Our operating expenses consist of cost of services, selling, general and administrative expenses and depreciation and amortization. The significant components of our expenses are further described below.
Cost of services
The majority of our cost of services expense is commission expense. Commission expenses are directly attributable to providing services to our clients for investment sales and financing services. Most of our investment sales and financing professionals are independent contractors and are paid commissions; however, there are some who are initially paid a salary and certain of our financing professionals are employees and, as such, costs of services also include employee-related compensation, employer taxes and benefits for those employees. The commission rates we pay to our investment sales and financing professionals vary based on individual contracts negotiated and are generally higher for the more experienced professionals. Some of our most senior investment sales and financing professionals also have the ability to earn additional commissions after meeting certain annual revenue thresholds. These additional commissions are recognized as cost of services in the period in which they are earned as they relate to specific transactions closed. Payment of a portion of these additional commissions are generally deferred for a period of three years, at the Company’s election, and paid at the beginning of the fourth calendar year. Cost of services also includes referral fees paid to other real estate brokers where the Company is the principal service provider. Cost of services, therefore, can vary based on the commission structure of the independent contractors that closed transactions in any particular period.
Selling, general and administrative expenses
The largest expense component within selling, general and administrative expenses is personnel expenses for our management team and sales and support staff. In addition, these costs include facilities costs (excluding depreciation and amortization), staff related expenses, sales, marketing, legal, telecommunication, network, data sources and other administrative expenses. Also included in selling, general and administrative are expenses for stock-based compensation to non-employee directors, employees and independent contractors (i.e. investment sales and financing professionals) under the 2013 Omnibus Equity Incentive Plan (“2013 Plan”) and the 2013 Employee Stock Purchase Plan (“2013 ESPP Plan”).
Depreciation and amortization expense
Depreciation and amortization expense consists of depreciation and amortization recorded on our computer software and hardware and furniture, fixture and equipment. Depreciation and amortization are provided over estimated useful lives ranging from three to seven years for owned assets or over the lesser of the asset estimated useful lives or the related lease term for leasehold improvements.
40
Other Income (Expense), Net
Other income (expense), net primarily consists of net gains or losses on our deferred compensation plan assets, interest income and realized gains and losses on our marketable securities, available-for-sale, foreign currency gains and losses and other non-operating gains and losses.
Interest Expense
Interest expense primarily consists of interest expense associated with the SARs liability, notes payable to former stockholders and our credit agreement.
Provision for Income Taxes
We are subject to U.S. and Canadian federal taxes and individual state and local taxes based on the income generated in the jurisdictions in which we operate. Our effective tax rate fluctuates as a result of the change in the mix of our activities in the jurisdictions in which we operate due to differing tax rates in those jurisdictions. Our provision for income taxes excludes the windfall benefits from shares issued in connection with our 2013 Plan and 2013 ESPP Plan.
Results of Operations
Following is a discussion of our results of operations for the years ended December 31, 2016, 2015 and 2014. The tables included in the period comparisons below provide summaries of our results of operations. The period-to-period comparisons of financial results are not necessarily indicative of future results.
Key Operating Metrics
We regularly review a number of key metrics to evaluate our business, measure our performance, identify trends affecting our business, formulate financial projections and make strategic decisions. During the years ended December 31, 2016, 2015 and 2014, we closed more than 8,900, 8,700 and 7,600 sales, financing and other transactions with total volume of approximately $42.3 billion, $37.8 billion and $33.1 billion, respectively. Such key metrics for real estate brokerage and financing activities are as follows:
| Year Ended December 31, |
||||||||||||
| Real Estate Brokerage: |
2016 | 2015 | 2014 | |||||||||
| Average Number of Investment Sales Professionals |
1,527 | 1,428 | 1,297 | |||||||||
| Average Number of Transactions per Investment Sales Professional |
4.24 | 4.43 | 4.31 | |||||||||
| Average Commission per Transaction |
$ | 102,258 | $ | 99,901 | $ | 93,943 | ||||||
| Average Commission Rate |
2.07 | % | 2.22 | % | 2.07 | % | ||||||
| Average Transaction Size (in thousands) |
$ | 4,935 | $ | 4,492 | $ | 4,537 | ||||||
| Total Number of Transactions |
6,476 | 6,332 | 5,588 | |||||||||
| Total Sales Volume (in millions) |
$ | 31,962 | $ | 28,444 | $ | 25,351 | ||||||
| Year Ended December 31, |
||||||||||||
| Financing: |
2016 | 2015 | 2014 | |||||||||
| Average Number of Financing Professionals |
98 | 85 | 79 | |||||||||
| Average Number of Transactions per Financing Professional |
16.83 | 18.84 | 16.86 | |||||||||
| Average Fee per Transaction |
$ | 26,314 | $ | 26,582 | $ | 25,436 | ||||||
| Average Fee Rate |
0.85 | % | 0.87 | % | 0.90 | % | ||||||
| Average Transaction Size (in thousands) |
$ | 3,093 | $ | 3,053 | $ | 2,837 | ||||||
| Total Number of Transactions |
1,651 | 1,601 | 1,332 | |||||||||
| Total Dollar Volume (in millions) |
$ | 5,107 | $ | 4,888 | $ | 3,779 | ||||||
41
Comparison of Year Ended December 31, 2016 and 2015
Below are key operating results for the year ended December 31, 2016 compared to the results for the year ended December 31, 2015 (dollars in thousands):
| Year Ended December 31, 2016 |
Percentage of Revenue |
Year Ended December 31, 2015 |
Percentage of Revenue |
Change |
||||||||||||||||||||
| Dollar | Percentage | |||||||||||||||||||||||
| Revenues: |
||||||||||||||||||||||||
| Real estate brokerage commissions |
$ | 662,220 | 92.3 | % | $ | 632,574 | 91.8 | % | $ | 29,646 | 4.7 | % | ||||||||||||
| Financing fees |
43,444 | 6.1 | 42,558 | 6.2 | 886 | 2.1 | ||||||||||||||||||
| Other revenues |
11,786 | 1.6 | 13,923 | 2.0 | (2,137 | ) | (15.3 | ) | ||||||||||||||||
|
|
|
|
|
|
|
|
|
|
|
|
|
|||||||||||||
| Total revenues |
717,450 | 100.0 | 689,055 | 100.0 | 28,395 | 4.1 | ||||||||||||||||||
|
|
|
|
|
|
|
|
|
|
|
|
|
|||||||||||||
| Operating expenses: |
||||||||||||||||||||||||
| Cost of services |
444,768 | 62.0 | 423,389 | 61.4 | 21,379 | 5.0 | ||||||||||||||||||
| Selling, general, and administrative expense |
161,794 | 22.6 | 147,710 | 21.4 | 14,084 | 9.5 | ||||||||||||||||||
| Depreciation and amortization expense |
4,387 | 0.6 | 3,305 | 0.6 | 1,082 | 32.7 | ||||||||||||||||||
|
|
|
|
|
|
|
|
|
|
|
|
|
|||||||||||||
| Total operating expenses |
610,949 | 85.2 | 574,404 | 83.4 | 36,545 | 6.4 | ||||||||||||||||||
|
|
|
|
|
|
|
|
|
|
|
|
|
|||||||||||||
| Operating income |
106,501 | 14.8 | 114,651 | 16.6 | (8,150 | ) | (7.1 | ) | ||||||||||||||||
| Other income (expense), net |
2,134 | 0.3 | 443 | — | 1,691 | nm | ||||||||||||||||||
| Interest expense |
(1,533 | ) | (0.2 | ) | (1,726 | ) | (0.2 | ) | 193 | (11.2 | ) | |||||||||||||
|
|
|
|
|
|
|
|
|
|
|
|
|
|||||||||||||
| Income before provision for income taxes |
107,102 | 14.9 | 113,368 | 16.4 | (6,266 | ) | (5.5 | ) | ||||||||||||||||
| Provision for income taxes |
42,445 | 5.9 | 47,018 | 6.8 | (4,573 | ) | (9.7 | ) | ||||||||||||||||
|
|
|
|
|
|
|
|
|
|
|
|
|
|||||||||||||
| Net income |
$ | 64,657 | 9.0 | % | $ | 66,350 | 9.6 | % | $ | (1,693 | ) | (2.6 | )% | |||||||||||
|
|
|
|
|
|
|
|
|
|
|
|
|
|||||||||||||
| Adjusted EBITDA (1) |
$ | 118,296 | 16.5 | % | $ | 124,140 | 18.0 | % | $ | (5,844 | ) | (4.7 | )% | |||||||||||
|
|
|
|
|
|
|
|
|
|
|
|
|
|||||||||||||
| (1) | Adjusted EBITDA is not a measurement of our financial performance under U.S. GAAP and should not be considered as an alternative to net income, operating income or any other measures derived in accordance with U.S. GAAP. For a definition of Adjusted EBITDA and a reconciliation of Adjusted EBITDA to net income, see “Non-GAAP Financial Measure.” |
Revenues
Our total revenues were $717.5 million in 2016 compared to $689.1 million in 2015, an increase of $28.4 million or 4.1%. Total revenues increased primarily as a result of increases in real estate brokerage commissions, which contributed to substantially all of the total increase. A slight increase in financing fees, partially offset by a decrease in other revenues contributed the remaining change in total revenues.
Real estate brokerage commissions. Revenues from real estate brokerage commissions increased to $662.2 million in 2016 from $632.6 million in 2015, an increase of $29.6 million or 4.7%. The increase was driven by a combination of the growth in the number of investment sales transactions (2.3%) and average transaction size (9.9%), partially offset by a decrease in average commission rates (15 basis points) due to a larger proportion of our transactions that closed in the >$20 million larger transaction market segment, which generate lower commission rates.
42
Financing fees. Revenues from financing fees increased to $43.4 million in 2016 from $42.6 million in 2015, an increase of $0.9 million or 2.1%. The increase was driven by an increase in the number of loan transactions (3.1%) due to an increase in the average number of financing professionals (15.3%), partially offset by a decrease in average fee rates (2 basis points) due in part to fees from certain larger loan transactions during 2016 as compared to 2015. Larger loan transactions generally earn a lower fee percentage.
Other revenues. Other revenues decreased to $11.8 million in 2016 from $13.9 million in 2015, a decrease of $2.1 million or 15.3%. The decrease was primarily driven by a decrease in consulting and advisory services during 2016 as compared to 2015.
Operating expenses
Our total operating expenses were $610.9 million in 2016 compared to $574.4 million in 2015, an increase of $36.5 million, or 6.4%. Expenses increased primarily due to an increase in cost of services, which is predominantly variable commissions paid to our investment sales professionals and compensation-related costs related to our financing activities. Selling, general and administrative costs and to a lesser extent depreciation and amortization increased as well, as described below.
Cost of services. Cost of services in 2016 increased $21.4 million, or 5.0%, to $444.8 million from $423.4 million in 2015. The increase was primarily due to increased commission expenses driven by increased revenues. Cost of services as a percent of total revenues increased to 62.0% for 2016 compared to 61.4% in 2015 primarily due to an increase in proportion of transactions closed by our more senior investment sales professionals who are compensated generally at higher commission rates, partially offset by a reduction in referral fees.
Selling, general and administrative expense. Selling, general and administrative expense in 2016 increased $14.1 million, or 9.5%, to $161.8 million from $147.7 million in 2015. Increases in our selling, general and administrative expense have been driven by our growth and investments in technology, sales and marketing tools and marketing and expansion of our services supporting our investment sales and financing professionals. These initiatives have primarily driven (i) a $6.7 million increase in sales and promotional marketing expenses to support increased sales activity and our annual sales recognition event; (ii) a $6.1 million increase in facilities expenses due to expansion of existing offices; (iii) a $5.7 million increase in salaries and related benefits as a result of increases in headcount in corporate and sales office support in connection with our growth and expansion of services supporting our investment sales and financing professionals; (iv) a $2.7 million increase in other expense categories, net, primarily driven by our expansion and growth. In addition, selling, general and administrative expense increased $2.5 million due to legal costs and accruals, partly driven by settlement of outstanding litigation and recoveries from a settlement with an insurance carrier during the twelve months ended December 31, 2015, which reduced legal costs in that period. These increases were offset by a $9.6 million decrease in management performance-related compensation driven by reduced bonus accruals due to management exceeding performance criteria during 2015.
Depreciation and amortization expense. Depreciation and amortization expense increased to $4.4 million in 2016 from $3.3 million in 2015, an increase of $1.1 million, or 32.7%. The increase is primarily driven by our expansion and growth and investment in technology to redesign sales and marketing tools.
Other income (expense), net
Other income (expense), net increased to $2.1 million in 2016 from $0.4 million in 2015. The increase was primarily driven by an increase in the value of our foreign currency gains related to our Canadian operations, interest income on our investments in marketable securities, available-for-sale and deferred compensation plan assets held in the rabbi trust. The increase was partially offset by realized losses on our investments in marketable securities, available-for-sale, due to a security sold during 2016, which no longer met our investment policy criteria.
43
Interest expense
There were no significant changes in interest expenses in 2016 as compared to 2015.
Provision for income taxes
The provision for income taxes was $42.4 million for 2016 as compared to $47.0 million in 2015, a decrease of $4.6 million or 9.7%. The effective tax rate for 2016 was 39.6%, compared with 41.5% in 2015. The decrease in the effective tax rate was primarily due to the change in the Company’s effective state tax rate on deferred taxes in 2015, which was minimal in 2016, lower net operating losses for our Canadian operations in 2016, which are subject to a full valuation allowance and other permanent items, primarily gains on company owned variable life insurance policies.
The provisions for income taxes excludes the difference in book and tax deductions associated with the settlement of shares under the Company’s 2013 Plan and disqualifying dispositions of shares issued from our 2013 ESPP Plan. Such tax benefits, which aggregated $2.7 million in 2016 and $6.2 million in 2015, respectively, were recorded directly to additional paid-in capital.
44
Comparison of Year Ended December 31, 2015 and 2014
Below are key operating results for the year ended December 31, 2015 compared to the results for the year ended December 31, 2014 (dollars in thousands):
| Year Ended December 31, 2015 |
Percentage of Revenue |
Year Ended December 31, 2014 |
Percentage of Revenue |
Change |
||||||||||||||||||||
| Dollar | Percentage | |||||||||||||||||||||||
| Revenues: |
||||||||||||||||||||||||
| Real estate brokerage commissions |
$ | 632,574 | 91.8 | % | $ | 524,951 | 91.7 | % | $ | 107,623 | 20.5 | % | ||||||||||||
| Financing fees |
42,558 | 6.2 | 33,881 | 6.0 | 8,677 | 25.6 | ||||||||||||||||||
| Other revenues |
13,923 | 2.0 | 13,356 | 2.3 | 567 | 4.2 | ||||||||||||||||||
|
|
|
|
|
|
|
|
|
|
|
|
|
|||||||||||||
| Total revenues |
689,055 | 100.0 | 572,188 | 100.0 | 116,867 | 20.4 | ||||||||||||||||||
|
|
|
|
|
|
|
|
|
|
|
|
|
|||||||||||||
| Operating expenses: |
||||||||||||||||||||||||
| Cost of services |
423,389 | 61.4 | 350,102 | 61.2 | 73,287 | 20.9 | ||||||||||||||||||
| Selling, general, and administrative expense |
147,710 | 21.4 | 134,274 | 23.5 | 13,436 | 10.0 | ||||||||||||||||||
| Depreciation and amortization expense |
3,305 | 0.6 | 3,206 | 0.5 | 99 | 3.1 | ||||||||||||||||||
|
|
|
|
|
|
|
|
|
|
|
|
|
|||||||||||||
| Total operating expenses |
574,404 | 83.4 | 487,582 | 85.2 | 86,822 | 17.8 | ||||||||||||||||||
|
|
|
|
|
|
|
|
|
|
|
|
|
|||||||||||||
| Operating income |
114,651 | 16.6 | 84,606 | 14.8 | 30,045 | 35.5 | ||||||||||||||||||
| Other income (expense), net |
443 | — | 28 | — | 415 | nm | ||||||||||||||||||
| Interest expense |
(1,726 | ) | (0.2 | ) | (1,651 | ) | (0.3 | ) | (75 | ) | 4.5 | |||||||||||||
|
|
|
|
|
|
|
|
|
|
|
|
|
|||||||||||||
| Income before provision for income taxes |
113,368 | 16.4 | 82,983 | 14.5 | 30,385 | 36.6 | ||||||||||||||||||
| Provision for income taxes |
47,018 | 6.8 | 33,452 | 5.8 | 13,566 | 40.6 | ||||||||||||||||||
|
|
|
|
|
|
|
|
|
|
|
|
|
|||||||||||||
| Net income |
$ | 66,350 | 9.6 | % | $ | 49,531 | 8.7 | % | $ | 16,819 | 34.0 | % | ||||||||||||
|
|
|
|
|
|
|
|
|
|
|
|
|
|||||||||||||
| Adjusted EBITDA (1) |
$ | 124,140 | 18.0 | % | $ | 92,824 | 16.2 | % | $ | 31,316 | 33.7 | % | ||||||||||||
|
|
|
|
|
|
|
|
|
|
|
|
|
|||||||||||||
| (1) | Adjusted EBITDA is not a measurement of our financial performance under U.S. GAAP and should not be considered as an alternative to net income, operating income or any other measures derived in accordance with U.S. GAAP. For a definition of Adjusted EBITDA and a reconciliation of Adjusted EBITDA to net income, see “Non-GAAP Financial Measure.” |
Revenues
Our total revenues were $689.1 million in 2015 compared to $572.2 million in 2014, an increase of $116.9 million, or 20.4%. Total revenues increased primarily as a result of increases in real estate brokerage commissions of $107.6 million, which contributed 92.1% of the total increase. An increase in financing fees of $8.7 million and to a lesser extent, an increase in other revenues of $0.6 million, contributed the remaining increase in total revenues.
Real estate brokerage commissions. Revenues from real estate brokerage commissions increased to $632.6 million in 2015 from $525.0 million in 2014, an increase of $107.6 million or 20.5%. The increase was primarily driven by an increase in the number of investment sales transactions (13.3%) and an increase in average commission rates (7.4%). The rise in average commission rates is due to an increase in the proportion of our $1-$10 million private client market segment transactions as compared to larger transactions in the middle and larger transaction market segments. Transactions in the private client market segment generally earn higher commission rates than the middle and larger transaction market segments.
45
Financing fees. Revenues from financing fees increased to $42.6 million in 2015 from $33.9 million in 2014, an increase of $8.7 million or 25.6%. The increase was driven by an increase in the number of loan transactions (20.2%) due to an increase in the number of financing professionals combined with an increase in their productivity levels and an increase in average transaction size (7.6%). Average commission rates decreased slightly primarily due to the increase in the average transaction size.
Other revenues. Other revenues increased to $13.9 million in 2015 from $13.4 million in 2014, an increase of $0.6 million or 4.2%.
Operating expenses
Our total operating expenses were $574.4 million in 2015 compared to $487.6 million in 2014, an increase of $86.8 million, or 17.8%. Expenses increased primarily due to an increase in cost of services, which is predominantly variable commissions paid to our investment sales and financing professionals and compensation-related costs related to our financing activities, but declined as a percentage of revenues. Selling, general and administrative costs increased as well, as described below.
Cost of services. Cost of services in 2015 increased $73.3 million, or 20.9% to $423.4 million from $350.1 million in 2014. The increase was primarily due to increased commission expenses driven by increased revenues. Cost of services as a percent of total revenues remained consistent at 61.4% in 2015 compared to 61.2% in 2014.
Selling, general and administrative expense. Selling, general and administrative expense in 2015 increased $13.4 million, or 10.0%, to $147.7 million from $134.3 million in 2014. The increase was primarily due to (i) a $4.4 million increase in management performance-related compensation driven by our improved operating results; (ii) a $4.1 million increase in salaries and related benefits as a result of higher headcount in corporate and office support in connection with our growth; (iii) a $4.0 million increase in sales and promotional expenses driven by an increase in our annual sales recognition event and marketing expenses to support increased sales activity; (iv) a $2.1 million, net increase in stock-based compensation expense driven by increases resulting from incremental share-based awards granted since the fourth quarter of 2014 and immediate vesting of certain RSU awards under the provisions of the RSU agreement, partially offset by a decrease in the Company’s stock price as RSU grants to the Company’s independent contractors are required to be measured at fair value; (v) a $2.0 million increase in facilities expenses due to office expansion; and (vi) a $1.8 million net increase in other expense categories primarily driven by our expansion and business growth. The increases were partially offset by a $5.0 million decrease in legal costs due to the settlement of outstanding litigation and recoveries from a settlement with an insurance carrier.
Depreciation and amortization expense. There were no significant changes in depreciation and amortization expenses in 2015 as compared to 2014.
Other income, net
Other income, net increased to $0.4 million in 2015 from $28,000 in 2014. The increase was primarily from interest income and realized gains on our investments in marketable securities, available-for-sale. The increase was partially offset by foreign currency losses related to our Canadian operations and a decrease in the value of our deferred compensation plan assets held in the rabbi trust.
Interest expense
There were no significant changes in interest expenses in 2015 as compared to 2014.
Provision for income taxes
The provision for income taxes was $47.0 million for 2015 as compared to $33.5 million in 2014, an increase of $13.6 million or 40.6%. The effective tax rate for 2015 was 41.5%, compared with 40.3% in 2014.
46
The increase in the effective tax rate was primarily due to the change in the Company’s effective state tax rate on deferred taxes and the valuation allowance related to our Canadian net operating loss carryforwards.
The provisions for income taxes excluded the excess tax deduction associated with the settlement of shares under the Company’s 2013 Plan, disqualifying dispositions of shares issued from our 2013 ESPP Plan and a tax deduction associated with IPO transaction costs because such tax benefits, which aggregated $6.2 million in 2015 and $5.2 million in 2014 were recorded as credits to additional paid-in capital.
Non-GAAP Financial Measure
In this Annual Report on Form 10-K, we include a non-GAAP financial measure, adjusted earnings before interest income/expense, taxes, depreciation and amortization and stock-based compensation, or Adjusted EBITDA. We define Adjusted EBITDA as net income before (i) interest income and other, including net realized (losses) gains on marketable securities, available-for-sale and cash and cash equivalents, (ii) interest expense, (iii) provision for income taxes, (iv) depreciation and amortization and (v) stock-based compensation expense. We use Adjusted EBITDA in our business operations to evaluate the performance of our business, develop budgets and measure our performance against those budgets, among other things. We also believe that analysts and investors use Adjusted EBITDA as a supplemental measure to evaluate our overall operating performance. However, Adjusted EBITDA has material limitations as an analytical tool and should not be considered in isolation, or as a substitute for analysis of our results as reported under U.S. generally accepted accounting principles (“U.S. GAAP”). We find Adjusted EBITDA as a useful tool to assist in evaluating performance because Adjusted EBITDA eliminates items related to capital structure, taxes and non-cash stock-based compensation charges. In light of the foregoing limitations, we do not rely solely on Adjusted EBITDA as a performance measure and also consider our U.S. GAAP results. Adjusted EBITDA is not a measurement of our financial performance under U.S. GAAP and should not be considered as an alternative to net income, operating income or any other measures calculated in accordance with U.S. GAAP. Because Adjusted EBITDA is not calculated in the same manner by all companies, it may not be comparable to other similarly titled measures used by other companies.
A reconciliation of the most directly comparable U.S. GAAP financial measure, net income, to Adjusted EBITDA is as follows (in thousands):
| Year Ended December 31, | ||||||||||||||||||||
| 2016 | 2015 | 2014 | 2013 | 2012 | ||||||||||||||||
| Net income |
$ | 64,657 | $ | 66,350 | $ | 49,531 | $ | 8,206 | $ | 27,934 | ||||||||||
| Adjustments: |
||||||||||||||||||||
| Interest income and other (1) |
(1,761 | ) | (1,373 | ) | (50 | ) | 356 | (166 | ) | |||||||||||
| Interest expense |
1,533 | 1,726 | 1,651 | 105 | 4 | |||||||||||||||
| Provision for income taxes |
42,445 | 47,018 | 33,452 | 13,735 | 21,507 | |||||||||||||||
| Depreciation and amortization |
4,387 | 3,305 | 3,206 | 3,043 | 2,981 | |||||||||||||||
| Stock-based compensation (2) |
7,035 | 7,114 | 5,034 | 35,841 | 7,448 | |||||||||||||||
|
|
|
|
|
|
|
|
|
|
|
|||||||||||
| Adjusted EBITDA (3) |
$ | 118,296 | $ | 124,140 | $ | 92,824 | $ | 61,286 | $ | 59,708 | ||||||||||
|
|
|
|
|
|
|
|
|
|
|
|||||||||||
| (1) | Other for the years ended December 31, 2016 and 2015 consists of $(121) and $132 of net realized (losses) gains on marketable securities available-for-sale and cash and cash equivalents. The year ended December 31, 2013 includes employer taxes related to DSUs and restricted stock in connection with IPO. |
| (2) | The year ended December 31, 2013 includes non-cash stock-based compensation charges of $30.9 million in connection with the IPO. |
| (3) | The decrease in Adjusted EBITDA for 2016 compared to 2015 is primarily due to a higher proportion of operating expenses compared to revenues. |
47
Liquidity and Capital Resources
Our primary sources of liquidity are cash and cash equivalents, cash flows from operations, marketable securities, available-for-sale and, if necessary borrowings under our credit agreement. In order to enhance yield to us, we have invested a portion of our cash in money market funds and in fixed and variable income debt securities, in accordance with our investment policy approved by the board of directors. Although we have historically funded our operations through operating cash flows, there can be no assurance that we can continue to meet our cash requirements entirely through our operations, cash and cash equivalents, proceeds from the sale of marketable securities, available-for-sale or availability under our credit agreement.
Cash held in our Canadian operations aggregated $404,000 and $763,000 at December 31, 2016 and 2015, respectively.
Cash Flows
Our total cash and cash equivalents balance increased by $91.2 million to $187.4 million at December 31, 2016, compared to $96.2 million at December 31, 2015. The following table sets forth our summary cash flows for the years ended December 31, 2016, 2015 and 2014 (in thousands):
| Year Ended December 31, | ||||||||||||
| 2016 | 2015 | 2014 | ||||||||||
| Net cash provided by operating activities |
$ | 74,486 | $ | 72,120 | $ | 71,437 | ||||||
| Net cash provided by (used in) investing activities |
19,819 | (126,929 | ) | (17,225 | ) | |||||||
| Net cash (used in) provided by financing activities |
(3,119 | ) | 1,835 | (6,005 | ) | |||||||
|
|
|
|
|
|
|
|||||||
| Net increase (decrease) in cash and cash equivalents |
91,186 | (52,974 | ) | 48,207 | ||||||||
| Cash and cash equivalents at beginning of period |
96,185 | 149,159 | 100,952 | |||||||||
|
|
|
|
|
|
|
|||||||
| Cash and cash equivalents at end of period |
$ | 187,371 | $ | 96,185 | $ | 149,159 | ||||||
|
|
|
|
|
|
|
|||||||
Operating Activities
2016 Compared to 2015. Cash flows provided by operating activities were $74.5 million in 2016 compared to $72.1 million in 2015. Net cash provided by operating activities is driven by our net income adjusted for non-cash items and changes in operating assets and liabilities. The $2.4 million increase in cash flows provided by operating activities in 2016 compared to the same period in 2015 was primarily due to the net effect of the growth of our business, differences in timing of payments and receipts, a reduction in the deferral of certain discretionary commissions, lower bonus accruals and a reduction of advances to the Company’s investment sales and financing professionals.
2015 Compared to 2014. Cash flows provided by operating activities were $72.1 million in 2015 compared to $71.4 million in 2014. Net cash provided by operating activities is driven by our net income adjusted for non-cash items and changes in operating assets and liabilities. The $0.7 million increase in cash flows provided by operating activities in 2015 compared to the same period in 2014 was primarily due to the growth in our business along with differences in timing of payments and receipts and bonus accruals related to our increased operating results.
Investing Activities
2016 Compared to 2015. Cash flows provided by investing activities were $19.8 million in 2016 compared to cash flows used in investing activities of $126.9 million in 2015. The change in cash flows provided by investing activities in 2016 compared to the same period in 2015 was primarily due to $29.7 million in net proceeds from the sale of marketable securities, available-for-sale for the year ended December 31, 2016 compared to $119.9 million in net purchases for the same period in 2015.
48
2015 Compared to 2014. Cash flows used for investing activities were $126.9 million in 2015 compared to $17.2 million in 2014. The increase in cash flows used for investing activities in 2015 compared to the same period in 2014 was primarily due to $119.9 million in net purchases of marketable securities, available-for-sale for the year ended December 31, 2015 compared to $14.7 million for the same period in 2014.
Financing Activities
2016 Compared to 2015. Cash flows used in financing activities were $3.1 million in 2016 compared to cash flows provided by financing activities of $1.8 million in 2015. The change in cash flows used in financing activities in 2016 compared to the same period in 2015, was primarily impacted by net changes in stock-based award activity, including excess tax benefit from stock-based award activity and taxes paid related to net share settlement of stock-based awards. See Note 10 – “Stock-Based Compensation Plans” our Notes to Consolidated Financial Statements for additional information.
2015 Compared to 2014. Cash flows provided by financing activities were $1.8 million in 2015 compared to cash flows used in financing activities of $6.0 million in 2014. The change in cash flows provided by financing activities in 2015 compared to the same period in 2014, was primarily impacted by net changes in stock-based award activity, including excess tax benefit from stock-based award activity. See Note 10 – “Stock-Based Compensation Plans” our Notes to Consolidated Financial Statements for additional information.
Liquidity
We believe that our existing balances of cash and cash equivalents, cash flows expected to be generated from our operations, proceeds from the sale of marketable securities, available-for-sale and borrowings available under the Credit Agreement (defined below) will be sufficient to satisfy our operating requirements for at least the next twelve months. If we need to raise additional capital through public or private debt or equity financings, strategic relationships or other arrangements, this capital might not be available to us in a timely manner, on acceptable terms or at all. Our failure to raise sufficient capital, when needed, could prevent us from funding acquisitions or otherwise financing our growth or operations. In addition, our notes payable to former stockholders and SARs liability have provisions, which could accelerate repayment of outstanding principal and accrued interest and adversely impact our liquidity.
Credit Agreement
On June 18, 2014, we entered into the Credit Agreement with Wells Fargo Bank, National Association (“Bank”), dated as of June 1, 2014 (the “Credit Agreement”). The Credit Agreement is intended to provide for future liquidity needs, if needed. The Credit Agreement provides for a $60.0 million principal amount senior secured revolving credit facility that is guaranteed by all of the Company’s domestic subsidiaries (the “Credit Facility”), which, as amended, matures on June 1, 2019. We may borrow, repay and reborrow amounts under the Credit Facility until its maturity date, at which time all amounts outstanding under the Credit Facility must be repaid in full. We must pay a commitment fee of up to 0.1% per annum, payable quarterly, based on the amount of unutilized commitments under the Credit Facility.
The Credit Facility includes a $10.0 million sublimit for the issuance of standby letters of credit, of which $533,000 was utilized at December 31, 2016. As of December 31, 2016, there were no amounts outstanding under the Credit Agreement.
Borrowings under the Credit Facility bear interest, at our option, at either the (i) Base Rate (defined as the highest of (a) the Bank’s prime rate, (b) the Federal Funds Rate plus 1.5% and (c) one-month LIBOR plus 1.5%), or (ii) at a variable rate between 0.875% and 1.125% above LIBOR, based upon the total funded debt to EBITDA ratio.
49
The Credit Facility contains customary covenants, including financial covenants (which require us, on a combined basis with our guarantors, to maintain (i) an EBITDAR Coverage Ratio (as defined in the Credit Agreement) of not less than 1.25:1.0 as of each quarter end on a rolling 4-quarter basis and (ii) total funded debt to EBITDA not greater than 2.0:1.0), reporting requirements and events of default. The Credit Facility is secured by substantially all of our assets, including pledges of 100% of the stock or other equity interest of each subsidiary except to the extent such property constitutes the capital stock of a controlled foreign corporation (as defined in the Internal Revenue Code), in which case no such pledge is required.
See Note 14 – “Commitments and Contingencies” of our Notes to Consolidated Financial Statements for additional information on the Credit Agreement.
Contractual Obligations and Commitments
The contractual obligations and other commitments consisted of the following at December 31, 2016 (in thousands):
| Total | Less than 1 Year |
1-3 Years | 3-5 Years | More Than 5 Years |
Other (7) | |||||||||||||||||||
| Operating lease obligations (1) |
$ | 76,335 | $ | 16,328 | $ | 26,996 | $ | 19,825 | $ | 13,186 | $ | — | ||||||||||||
| SARs liability (principal and interest) (2) |
31,966 | 1,366 | 3,217 | 3,866 | 23,517 | — | ||||||||||||||||||
| Notes payable (principal and interest) (3) |
11,315 | 1,472 | 2,946 | 6,897 | — | — | ||||||||||||||||||
| Deferred commissions payable (4) |
36,236 | 16,844 | 19,392 | — | — | — | ||||||||||||||||||
| Deferred compensation liability (5) |
7,012 | 607 | 1,520 | 1,439 | 153 | 3,293 | ||||||||||||||||||
| Other (6) |
3,725 | 3,550 | 175 | — | — | — | ||||||||||||||||||
|
|
|
|
|
|
|
|
|
|
|
|
|
|||||||||||||
| $ | 166,589 | $ | 40,167 | $ | 54,246 | $ | 32,027 | $ | 36,856 | $ | 3,293 | |||||||||||||
|
|
|
|
|
|
|
|
|
|
|
|
|
|||||||||||||
| (1) | See Note 14 – “Commitments and Contingencies” of our Notes to the Consolidated Financial Statements. |
| (2) | Forecasted principal payments are based on each participant estimated retirement age and contractual interest rate of 4.446% on January 1, 2017 and reflects required payments that resulted from the retirement of certain executives. See Note 4 – “Selected Balance Sheet Data” of our Notes to the Consolidated Financial Statements. |
| (3) | See Note 6 – “Notes Payable to Former Stockholders” of our Notes to the Consolidated Financial Statements. |
| (4) | Includes short-term and long-term deferred commissions payable. See Note 4 – “Selected Balance Sheet Data” of our Notes to the Consolidated Financial Statements. |
| (5) | Represents current estimated payouts for participants currently receiving payments based on their elections at the time of deferral. The Company holds assets held in Rabbi Trust of $7.3 million to settle outstanding amounts when they become due. Amounts assume no increase in asset or liability due to future returns. See Note 4 – “Selected Balance Sheet Data” of our Notes to the Consolidated Financial Statements. |
| (6) | See Note 14 – “Commitments and Contingencies” of our Notes to the Consolidated Financial Statements. |
| (7) | Amounts in Other represent amounts where payments are dependent on future events, which may occur at any time from less than 1 year to more than 5 years, based on the participants’ elections at the time of deferral. |
Off Balance Sheet Arrangements
We do not have any off balance sheet arrangements.
Inflation
Our commissions and other variable costs related to revenue are primarily affected by real estate market supply and demand, which may be affected by general economic conditions including inflation. However, to date, we do not believe that general inflation has had a material impact upon our operations.
50
Critical Accounting Policies and Estimates
We prepare our financial statements in accordance with U.S. generally accepted accounting principles. In applying many of these accounting principles, we make assumptions, estimates and/or judgments that affect the reported amounts of assets, liabilities, revenues and expenses in our consolidated financial statements. We base our estimates and judgments on historical experience and other assumptions that we believe are reasonable under the circumstances. These assumptions, estimates and/or judgments, however, are often subjective and our actual results may change negatively or positively based on changing circumstances or changes in our analyses. If actual amounts are ultimately different from our estimates, the revisions are included in our results of operations for the period in which the actual amounts become known.
We believe that the critical accounting policies discussed below involve a greater degree of judgment or complexity than our other accounting policies. Accordingly, these are the policies we believe are the most critical to aid in fully understanding and evaluating our consolidated financial condition and results of operations. See the notes to our consolidated financial statements for a summary of our significant accounting policies.
Revenue Recognition
We generate real estate brokerage commissions by acting as a broker for real estate owners or investors seeking to buy or sell commercial properties. Revenues from real estate brokerage commissions and financing fees from securing financing on purchase transactions as well as fees earned from refinancing its clients’ existing mortgage debt and other financing activities are recognized in principally all cases on the close of escrow or when the loan closes.
Stock-Based Compensation
We initially value restricted stock units and restricted stock awards based on the grant date closing price of our common stock and recognize the related expense on a straight-line basis over the requisite service period for the entire award, subject to periodic adjustments to ensure that the cumulative amount of expense recognized through the end of any reporting period is at least equal to the portion of the grant date value of the award that has vested through that date. Awards made to our independent contractors, who are primarily our investment sales professionals, are accounted for as liability awards and require remeasurement to fair value at the end of each reporting period. Compensation expense is adjusted for estimated forfeitures and is recognized on a straight-line basis over the requisite service period of the award. We may be required to use judgment in determining the service period for awards granted based on contract terms. Forfeiture assumptions for all stock-based awards are based on historical forfeitures for different classes of service providers. Assumptions are evaluated on a quarterly basis and updated as necessary. After adoption of ASU 2016-09, Improvements to Employee Share-Based Payment Accounting on January 1, 2017, the Company will change its accounting for forfeitures to as they occur.
We estimate the grant-date fair value for issuances under the 2013 ESPP Plan using the Black-Scholes option-pricing model. We determined that the plan was a compensatory plan and the Company is required to expense the fair value of the awards over each six-month offering period. We use judgments and assumptions in determining the value of the awards. We calculate the expected volatility based on the historical volatility of our common stock and the risk-free interest rate based on the U.S. Treasury yield curve in effect at the time of grant, both consistent with the term of the offering period. We incorporate no forfeiture rate and include no expected dividend yield as the Company has not paid, and currently does not intend to pay, a regular dividend.
Income Taxes
We account for income taxes under the asset and liability method. We recognize deferred tax assets and liabilities for the future tax consequences attributable to (1) differences between the financial statement carrying amounts of existing assets and liabilities and their respective tax basis, and (2) operating losses and tax credit
51
carryforwards. We measure existing deferred tax assets and liabilities using enacted tax rates expected to apply to taxable income in the years in which we expect to have temporary differences realized or settled. We recognize in the provision for income taxes the effect on deferred tax assets and liabilities of a change in tax rates in the period that includes the enactment date. Valuation allowances are provided against deferred tax assets when it is more-likely-than-not that some portion or all of the deferred tax asset will not be realized.
Because of the nature of our business, which includes activity in the U.S. and Canada, incorporating numerous states and provinces as well as local jurisdictions, our tax position can be complex. As such, we use estimates to determine state tax apportionment, foreign and local taxes, recognized and unrecognized tax positions, tax related interest and penalties, valuation allowances and other permanent items, all which impact our effective tax rate. Changes in these estimates are as a result of changes in the mix of our activity in the various jurisdictions in which we operate and changes in the nature and extent of other estimates.
We evaluate the tax positions taken quarterly. The threshold for recognizing the benefits of tax return positions in the financial statements is “more likely than not” to be sustained by the taxing authority and requires measurement of a tax position meeting the more-likely-than-not criterion, based on the largest benefit that is more than 50% likely to be realized.
We recognize interest and penalties incurred as income tax expense.
Prior to the IPO, we were part of a consolidated federal income tax return and various combined and consolidated state tax returns that were filed by our previous parent. We had a tax-sharing agreement whereby we provided for income taxes in our consolidated statements of net and comprehensive income using an effective tax rate of 43.5%.
Investments in Marketable Securities, Available-for-sale
We maintain a portfolio of cash equivalents and investments in a variety of fixed and variable rate securities, including U.S. treasuries, U.S. government sponsored entities, corporate debt securities, asset-backed securities and other. We consider our investment in marketable securities to be available-for-sale. Accordingly, these investments are recorded at their fair values, with unrealized gains or losses recorded in other comprehensive income (loss), net of tax. We determine the appropriate classification of investments in marketable securities at the time of purchase. Interest, along with accretion and amortization of purchase premiums and discounts, which are recorded over the remaining weighted average life of the security, are included in other income (expense), net in the consolidated statements of net and comprehensive income.
We regularly review our investment portfolio to determine if any security is other-than-temporarily impaired, which would require us to record an impairment charge in the period any such determination is made. In making this judgment, we evaluate, among other items, the time frame and extent to which the fair market value of a security is less than its amortized cost and our intent and ability to sell, or whether we will more likely than not be required to sell, the security before recovery of its amortized cost basis. The assumptions and judgments may change based on changes in our operations or future plans.
Litigation
We are subject to various legal proceeding and claims that arise in the ordinary course of business, some of which involve claims for damages that are substantial in amount. Most of these litigation matters are covered by insurance which contain deductibles, exclusions, claim limits and aggregate policy limits. While the ultimate liability for these legal proceeding cannot be determined, we use judgment in the evaluation claims and the need for accrual for loss contingencies quarterly. We record an accrual for litigation related losses where we determine the likelihood of loss is both probable and estimable. We accrue legal fees for litigation as the legal services are provided.
52
Leases
We lease all of our facilities under operating lease agreements. Lease agreements may contain periods of free rent or reduced rent or contain predetermined fixed increases in the minimum rent. We recognize the minimum lease payments as rent expense on a straight-line basis over the noncancellable term of the lease. We record the difference between the amount charged to rent expense and the rent paid as a deferred rent obligation. We typically lease general purpose built-out office space, which reverts to the lessor upon termination of the lease. Any payments for improvements, net of incentives received, are recorded as prepaid rent. Prepaid rent is amortized using the straight-line method over the expected lease term as a charge to rent expense.
Recent Accounting Pronouncements
For information regarding recent accounting pronouncements, see Note 2 – “Accounting Policies” of our Notes to the Consolidated Financial Statements set forth in Item 8 of this Annual Report on Form 10-K.
Item 7A. Quantitative and Qualitative Disclosures About Market Risk
We maintain a portfolio of investments in a variety of fixed and variable rate securities, including U.S. government and federal agency securities, corporate debt securities and asset backed securities. As of December 31, 2016, the fair value of investments in marketable securities, available-for-sale was $104.9 million. The primary objective of our investment activity is to maintain the safety of principal, provide for future liquidity requirements while maximizing yields without significantly increasing risk. While some investments may be securities of companies in foreign countries, all investments are denominated and payable in U.S. Dollars. We do not enter into investments for trading or speculative purposes. While our intent is not to sell these investment securities prior to maturity, we may choose to sell any of the securities based on market opportunities to enhance our overall yield, maintain compliance with our investment policy or manage liquidity requirements, duration, and when a security no longer meets the criteria of the Company’s investment policy. We do not use derivatives or similar instruments to manage our interest rate risk. We seek to invest in high quality investments, with a weighted average rating (exclusive of cash and cash equivalents) of AA+ as of December 31, 2016. Maturities are maintained consistent with our short, medium and long-term liquidity objectives.
Currently, our portfolio of investments predominantly consists of fixed interest rate debt securities; however, a portion of our investment portfolio may consist of variable interest rate debt securities. Our investments in fixed interest rate debt securities are subject to market risk. Changes in prevailing interest rates may adversely impact their fair market value should interest rates generally rise or fall. Accordingly, we also may have interest rate risk with the variable rate debt securities as the income produced may decrease if interest rates fall. The following table sets forth the impact on the fair value of our investments from changes in interest rates based on the duration of the securities (dollars in thousands):
| Change in Interest Rates |
Approximate Change in Fair Value of Investments Increase (Decrease) |
|||
| 2% Decrease | $ | 3,834 | ||
| 1% Decrease | $ | 2,282 | ||
| 1% Increase | $ | (2,318 | ) | |
| 2% Increase | $ | (4,638 | ) | |
Due to the nature of our business and the manner in which we conduct our operations, we believe we do not face any material interest rate risk with respect to other assets and liabilities, equity price risk or other market risks. The functional currency of our Canadian operations is the Canadian dollar. We are exposed to foreign currency exchange rate risk for the settlement of transactions of the Canadian operations as well as unrealized translation adjustments. To date, realized foreign currency exchange rate gains and losses have not been material.
53
Item 8. Financial Statements and Supplementary Data
See pages beginning at F-1.
Item 9. Changes in and Disagreements with Accountants on Accounting and Financial Disclosure
None.
Item 9A. Controls and Procedures
Evaluation of Disclosure Controls and Procedures
Our management is responsible for establishing and maintaining adequate internal control over financial reporting, as such term is defined in Exchange Act Rules 13a-15(f), including maintenance of (i) records that in reasonable detail accurately and fairly reflect the transactions and dispositions of our assets, and (ii) policies and procedures that provide reasonable assurance that (a) transactions are recorded as necessary to permit preparation of financial statements in accordance with accounting principles generally accepted in the United States of America, (b) our receipts and expenditures are being made only in accordance with authorizations of management and our board of directors and (c) we will prevent or timely detect unauthorized acquisition, use, or disposition of our assets that could have a material effect on the financial statements.
Our management, with the supervision and participation of our chief executive officer (“CEO”) and chief financial officer (“CFO”), has evaluated the effectiveness of our disclosure controls and procedures (as defined in Rules 13a- 15(e) and 15d- 15(e) under the Exchange Act, as of the end of the period covered by this Annual Report on Form 10-K, based on the criteria established in Internal Control-Integrated Framework issued by the Committee of Sponsoring Organizations of the Treadway Commission (“COSO”) (2013 framework). Based on such evaluation, our management has concluded that as of December 31, 2016, our disclosure controls and procedures are designed at a reasonable assurance level and are effective to provide reasonable assurance that information we are required to disclose in reports that we file or submit under the Exchange Act is recorded, processed, summarized, and reported within the time periods specified in the rules and forms of the SEC, and that such information is accumulated and communicated to our management, including our CEO and CFO, as appropriate, to allow timely decisions regarding required disclosure.
Management’s Report on Internal Control over Financial Reporting
Our management is responsible for establishing and maintaining adequate internal control over financial reporting, as defined in Rules 13a-15(f) and 15d-15(f) under the Exchange Act.
Our system of internal control is designed to provide reasonable assurance regarding the reliability of financial reporting and preparation of our financial statements for external reporting purposes in accordance with United States generally accepted accounting principles. Our management, including our CEO and CFO, assessed the effectiveness of our internal control over financial reporting as of December 31, 2016. In conducting its assessment, management used the criteria issued by the COSO. Based on this assessment, management concluded that, as of December 31, 2016, our internal control over financial reporting was effective based on those criteria.
Management, including our CEO and CFO, does not expect that our disclosure controls and procedures, or our internal controls will prevent all error and fraud. A control system, no matter how well conceived and operated, can provide only reasonable, not absolute, assurance that the objectives of the control system are met. Further, the design of a control system must reflect the fact that there are resource constraints and the benefit of controls must be considered relative to their costs. Because of the inherent limitations in all control systems, no evaluation of controls can provide absolute assurance that all control issues and instances of fraud, if any, have been detected.
54
Changes in Internal Control over Financial Reporting
There have not been any changes in our internal control over financial reporting (as such term is defined in Rules 13a-15(f) and 15d-15(f) under the Exchange Act) during the quarter ended December 31, 2016 that have materially affected, or are reasonably likely to materially affect, our internal control over financial reporting.
Inherent Limitations on Effectiveness of Controls
In designing and evaluating the disclosure controls and procedures, management recognizes that any controls and procedures, no matter how well designed and operated, can provide only reasonable assurance of achieving the desired control objectives. In addition, the design of disclosure controls and procedures must reflect the fact that there are resource constraints and that management is required to apply judgment in evaluating the benefits of possible controls and procedures relative to their costs. Internal control over financial reporting cannot provide absolute assurance of achieving financial reporting objectives because of the inherent limitations of any system of internal control. Internal control over financial reporting is a process that involves human diligence and compliance and is subject to lapses of judgment and breakdowns resulting from human failures. Internal control over financial reporting also can be circumvented by collusion or improper overriding of controls. As a result of such limitations, there is risk that material misstatements may not be prevented or detected on a timely basis by internal control over financial reporting. However, these inherent limitations are known features of the financial reporting process. Therefore, it is possible to design into the process safeguards to reduce, though not eliminate, this risk.
None.
55
Item 10. Directors, Executive Officers and Corporate Governance
Executive Officers
The names and ages of our executive officers and directors as of March 1, 2017 are as follows:
| Name |
Age | Position(s) | ||
| Hessam Nadji |
51 | President, Chief Executive Officer and Director | ||
| Mitchell R. LaBar |
57 | Chief Operating Officer and Executive Vice President | ||
| Martin E. Louie |
55 | Chief Financial Officer | ||
| William E. Hughes, Jr. |
67 | Senior Vice President, Marcus and Millichap Capital Corporation |
Hessam Nadji
Mr. Nadji has served as President and Chief Executive Officer and as a director of the Company since March 31, 2016. Prior to his appointment as President and Chief Executive Officer of the Company, Mr. Nadji served as senior executive vice president from May 2015. Mr. Nadji joined the Company as vice president of research in 1996, became senior vice president in 1997, was appointed managing director in 2000, and became chief strategy officer and senior vice president responsible for the Company’s specialty brokerage divisions as well as research, advisory services and marketing in 2013. Mr. Nadji has extensive knowledge of the Company and over 30 years of experience working in the real estate industry. Mr. Nadji received a B.S. in information management and computer science from City University in Seattle.
Mitchell R. LaBar
Mr. LaBar has served as Executive Vice President and Chief Operating Officer since March 2016. Before assuming this position, Mr. LaBar was employed with the Company from 1984 to 2008. He joined the Company in 1984 as an investment sales professional, was promoted to regional manager, then division manager and, then, served as a managing director in the Company until 2008. Mr. LaBar was instrumental in helping grow certain of the Company’s markets, including offices in Southern California and subsequently Manhattan and other offices in the Northeast. In 2008, Mr. LaBar left the Company to pursue private real estate investing for his family trust. From March 2015 to March 2016, Mr. LaBar served as a consultant to the Company. He received a B.S. in Economics from Brigham Young University.
Martin E. Louie
Mr. Louie has served as Chief Financial Officer since 2010. Prior to becoming Chief Financial Officer, Mr. Louie was First Vice President of Finance beginning in 2009, and Vice President of Finance from 2006 to 2009. Mr. Louie has served as a senior financial executive with worldwide responsibilities for various companies, including Sony Pictures Entertainment, The Walt Disney Co., Infineon Technologies and West Marine. In those roles, he was responsible for accounting, strategic planning, financial planning and analysis, treasury and investor relations. Prior to that, Mr. Louie, who is a CPA, was with KPMG. Mr. Louie received a B.A. in Economics from the University of California, Los Angeles and an MBA in Finance from the University of Southern California.
William E. Hughes, Jr.
Mr. Hughes has served as Senior Vice President of our subsidiary MMCC since 2000. He became a Managing Director of Marcus & Millichap in 2008. Mr. Hughes is responsible for managing MMCC’s operations on a national basis. He joined Marcus & Millichap in 1996 and has a diversified background in real estate finance, financial consulting and modeling, project feasibility, leasing, construction management and real estate development. Prior to joining the Company, Mr. Hughes held various senior executive roles with several financial and real estate investment firms. He received a B.S. in Business Administration from the University of Southern California.
56
Other Proxy Information
Certain information required by this Item is incorporated herein by reference to information appearing in our definitive Proxy Statement for our Annual Meeting of Stockholders to be held on May 4, 2017 (“Proxy Statement”), which information will appear under the captions entitled “Proposal 1: Election of Directors” and “Other Matters” in the Proxy Statement.
Code of Ethics
We have adopted a Code of Ethics that applies to all of our executive officers and directors. The Code of Ethics is posted on our website. The Internet address for our website is http://www.marcusmillichap.com, and the Code of Ethics may be found as follows:
| • | From our main web page, click on “Investor Relations” at the bottom of the main web page. |
| • | Next click on “Corporate Governance” in the left hand navigation bar. |
| • | The click on “Governance Documents.” |
| • | Finally, click on “Code of Ethics.” |
We intend to satisfy the disclosure requirements under Item 5.05(c) of Form 8-K regarding an amendment to, or waiver from, a provision of the Code of Ethics that applies to our principal executive officer, principal financial officer, principal accounting officer or controller or persons performing similar functions by posting such information on our website, at the address and location specified above.
Item 11. Executive Compensation
The information required by this Item is incorporated herein by reference to information appearing in our definitive Proxy Statement for our Annual Meeting of Stockholders to be held on May 4, 2017, which information will appear under the caption entitled “Compensation of the Named Executive Officers and Directors” in the Proxy Statement.
Item 12. Security Ownership of Certain Beneficial Owners and Management and Related Stockholder Matters
The information required by this Item is incorporated herein by reference to information appearing in our definitive Proxy Statement for our Annual Meeting of Stockholders to be held on May 4, 2017, which information will appear under the caption entitled “Proposal 3: Approval of the Amended and Restated 2013 Omnibus Equity Incentive Plan – Equity Compensation Plan Information” in the Proxy Statement.
Item 13. Certain Relationships and Related Transactions, and Director Independence
Any information required by this Item is incorporated herein by reference to information appearing in our definitive Proxy Statement for our Annual Meeting of Stockholders to be held on May 4, 2017, which information will appear under the captions entitled “Proposal 1: Election of Directors” and “Certain Relationships and Related Party Transactions” in the Proxy Statement.
Item 14. Principal Accounting Fees and Services
The information required by this Item is incorporated herein by reference to information appearing in our definitive Proxy Statement for our Annual Meeting of Stockholders to be held on May 4, 2017, which information will appear under the caption entitled “Proposal 2: Ratification of Appointment of Independent Registered Public Accounting Firm for 2017” in the Proxy Statement.
57
Item 15. Exhibits, Financial Statement Schedules
| (a) | The following documents are filed as part of this Report: |
| (1) | Consolidated Financial Statements |
The consolidated financial statements listed in the accompanying Index to Consolidated Financial Statements are attached to this Form 10-K beginning on page F-1.
| Report of Independent Registered Public Accounting Firm |
| Consolidated Balance Sheets as of December 31, 2016 and 2015 |
| Consolidated Statements of Net and Comprehensive Income for the years ended December 31, 2016, 2015 and 2014 |
| Consolidated Statements of Stockholders’ Equity for the years ended December 31, 2016, 2015 and 2014 |
| Consolidated Statements of Cash Flows for the years ended December 31, 2016, 2015 and 2014 |
| Notes to Consolidated Financial Statements |
| (2) | Financial Statement Schedules |
The financial statement schedules have been omitted because they are not applicable or the information required to be set forth therein is included in the consolidated financial statements or notes thereto.
| (b) | Exhibits |
See the Exhibit Index following the signature page to this Annual Report on Form 10-K for a list of exhibits filed or furnished with this report, which Exhibit Index is incorporated herein by reference.
| (c) | Financial Statement Schedules |
Not applicable.
None.
58
Pursuant to the requirements of Section 13 or 15(d) of the Securities Exchange Act of 1934, the registrant has duly caused this report to be signed on its behalf by the undersigned, thereunto duly authorized.
| Dated: March 16, 2017 | Marcus & Millichap, Inc. | |||||
| /s/ Hessam Nadji | ||||||
| Hessam Nadji | ||||||
| President and Chief Executive Officer | ||||||
Pursuant to the requirements of the Securities Exchange Act of 1934, this report has been signed below by the following persons on behalf of the registrant and in the capacities and on the dates indicated.
| Signature |
Title |
Date | ||
| /s/ Hessam Nadji Hessam Nadji |
Director, President and Chief Executive Officer (Principal Executive Officer) | March 16, 2017 | ||
| /s/ Martin E. Louie Martin E. Louie |
Chief Financial Officer (Principal Financial Officer) |
March 16, 2017 | ||
| /s/ Kurt H. Schwarz Kurt H. Schwarz |
Vice President of Finance and Chief Accounting Officer (Principal Accounting Officer) | March 16, 2017 | ||
| /s/ George M. Marcus George M. Marcus |
Director | March 16, 2017 | ||
| /s/ William A. Millichap William A. Millichap |
Director | March 16, 2017 | ||
| /s/ Norma J. Lawrence Norma J. Lawrence |
Director | March 16, 2017 | ||
| /s/ Nicholas F. McClanahan Nicholas F. McClanahan |
Director | March 16, 2017 | ||
| /s/ George T. Shaheen George T. Shaheen |
Director | March 16, 2017 | ||
| /s/ Don C. Watters Don C. Watters |
Director | March 16, 2017 | ||
59
MARCUS & MILLICHAP, INC.
INDEX TO CONSOLIDATED FINANCIAL STATEMENTS
F-1
Report of Independent Registered Public Accounting Firm
The Board of Directors and Stockholders of
Marcus & Millichap, Inc.:
We have audited the accompanying consolidated balance sheets of Marcus & Millichap, Inc. (the Company) as of December 31, 2016 and 2015, and the related consolidated statements of net and comprehensive income, stockholders’ equity and cash flows for each of the three years in the period ended December 31, 2016. These financial statements are the responsibility of the Company’s management. Our responsibility is to express an opinion on these financial statements based on our audits.
We conducted our audits in accordance with the standards of the Public Company Accounting Oversight Board (United States). Those standards require that we plan and perform the audit to obtain reasonable assurance about whether the financial statements are free of material misstatement. We were not engaged to perform an audit of the Company’s internal control over financial reporting. Our audits included consideration of internal control over financial reporting as a basis for designing audit procedures that are appropriate in the circumstances, but not for the purpose of expressing an opinion on the effectiveness of the Company’s internal control over financial reporting. Accordingly, we express no such opinion. An audit also includes examining, on a test basis, evidence supporting the amounts and disclosures in the financial statements, assessing the accounting principles used and significant estimates made by management, and evaluating the overall financial statement presentation. We believe that our audits provide a reasonable basis for our opinion.
In our opinion, the financial statements referred to above present fairly, in all material respects, the consolidated financial position of Marcus & Millichap, Inc. at December 31, 2016 and 2015, and the consolidated results of its operations and its cash flows for each of the three years in the period ended December 31, 2016, in conformity with U.S. generally accepted accounting principles.
/s/ Ernst & Young LLP
Los Angeles, California
March 16, 2017
F-2
MARCUS & MILLICHAP, INC.
(dollar amounts in thousands, except per share amounts)
| December 31, | ||||||||
| 2016 | 2015 | |||||||
| Assets |
||||||||
| Current assets: |
||||||||
| Cash and cash equivalents |
$ | 187,371 | $ | 96,185 | ||||
| Commissions receivable |
4,809 | 3,342 | ||||||
| Prepaid expenses |
8,094 | 7,542 | ||||||
| Income tax receivable |
1,182 | 4,049 | ||||||
| Marketable securities, available-for-sale |
27,454 | 79,860 | ||||||
| Other assets, net |
5,102 | 5,136 | ||||||
|
|
|
|
|
|||||
| Total current assets |
234,012 | 196,114 | ||||||
| Prepaid rent |
13,285 | 9,075 | ||||||
| Property and equipment, net |
16,355 | 11,579 | ||||||
| Marketable securities, available–for-sale |
77,475 | 54,395 | ||||||
| Assets held in rabbi trust |
7,337 | 5,661 | ||||||
| Deferred tax assets, net |
35,571 | 35,285 | ||||||
| Other assets |
9,981 | 9,116 | ||||||
|
|
|
|
|
|||||
| Total assets |
$ | 394,016 | $ | 321,225 | ||||
|
|
|
|
|
|||||
| Liabilities and stockholders’ equity |
||||||||
| Current liabilities: |
||||||||
| Accounts payable and accrued expenses |
$ | 10,133 | $ | 9,135 | ||||
| Notes payable to former stockholders |
986 | 939 | ||||||
| Deferred compensation and commissions |
44,754 | 34,091 | ||||||
| Accrued bonuses and other employee related expenses |
22,303 | 30,846 | ||||||
|
|
|
|
|
|||||
| Total current liabilities |
78,176 | 75,011 | ||||||
| Deferred compensation and commissions |
44,455 | 43,678 | ||||||
| Notes payable to former stockholders |
8,686 | 9,671 | ||||||
| Deferred rent and other liabilities |
3,845 | 3,875 | ||||||
|
|
|
|
|
|||||
| Total liabilities |
135,162 | 132,235 | ||||||
|
|
|
|
|
|||||
| Commitments and contingencies |
— | — | ||||||
| Stockholders’ equity: |
||||||||
| Preferred stock, $0.0001 par value: |
||||||||
| Authorized shares – 25,000,000; issued and outstanding shares – none at December 31, 2016 and 2015, respectively |
— | — | ||||||
| Common stock, $0.0001 par value: |
||||||||
| Authorized shares – 150,000,000; issued and outstanding shares – 37,882,266 and 37,396,456 at December 31, 2016 and 2015, respectively |
4 | 4 | ||||||
| Additional paid-in capital |
85,445 | 80,591 | ||||||
| Stock notes receivable from employees |
(4 | ) | (4 | ) | ||||
| Retained earnings |
172,599 | 107,942 | ||||||
| Accumulated other comprehensive income |
810 | 457 | ||||||
|
|
|
|
|
|||||
| Total stockholders’ equity |
258,854 | 188,990 | ||||||
|
|
|
|
|
|||||
| Total liabilities and stockholders’ equity |
$ | 394,016 | $ | 321,225 | ||||
|
|
|
|
|
|||||
See accompanying notes to consolidated financial statements.
F-3
MARCUS & MILLICHAP, INC.
CONSOLIDATED STATEMENTS OF NET AND COMPREHENSIVE INCOME
(dollar and share amounts in thousands, except per share amounts)
| Year Ended December 31, | ||||||||||||
| 2016 | 2015 | 2014 | ||||||||||
| Revenues: |
||||||||||||
| Real estate brokerage commissions |
$ | 662,220 | $ | 632,574 | $ | 524,951 | ||||||
| Financing fees |
43,444 | 42,558 | 33,881 | |||||||||
| Other revenues |
11,786 | 13,923 | 13,356 | |||||||||
|
|
|
|
|
|
|
|||||||
| Total revenues |
717,450 | 689,055 | 572,188 | |||||||||
|
|
|
|
|
|
|
|||||||
| Operating expenses: |
||||||||||||
| Cost of services |
444,768 | 423,389 | 350,102 | |||||||||
| Selling, general, and administrative expense |
161,794 | 147,710 | 134,274 | |||||||||
| Depreciation and amortization expense |
4,387 | 3,305 | 3,206 | |||||||||
|
|
|
|
|
|
|
|||||||
| Total operating expenses |
610,949 | 574,404 | 487,582 | |||||||||
|
|
|
|
|
|
|
|||||||
| Operating income |
106,501 | 114,651 | 84,606 | |||||||||
| Other income (expense), net |
2,134 | 443 | 28 | |||||||||
| Interest expense |
(1,533 | ) | (1,726 | ) | (1,651 | ) | ||||||
|
|
|
|
|
|
|
|||||||
| Income before provision for income taxes |
107,102 | 113,368 | 82,983 | |||||||||
| Provision for income taxes |
42,445 | 47,018 | 33,452 | |||||||||
|
|
|
|
|
|
|
|||||||
| Net income |
64,657 | 66,350 | 49,531 | |||||||||
| Other comprehensive income: |
||||||||||||
| Unrealized gain (loss) on marketable securities, net of tax of $197, $(394) and $16 for the years ended December 31, 2016, 2015 and 2014, respectively |
313 | (592 | ) | 24 | ||||||||
| Foreign currency translation gain (loss), net of tax of $0, $(90) and $90 for the years ended December 31, 2016, 2015 and 2014, respectively |
40 | 890 | 135 | |||||||||
|
|
|
|
|
|
|
|||||||
| Total other comprehensive income |
353 | 298 | 159 | |||||||||
|
|
|
|
|
|
|
|||||||
| Comprehensive income |
$ | 65,010 | $ | 66,648 | $ | 49,690 | ||||||
|
|
|
|
|
|
|
|||||||
| Earnings per share: |
||||||||||||
| Basic |
$ | 1.66 | $ | 1.71 | $ | 1.27 | ||||||
| Diluted |
$ | 1.66 | $ | 1.69 | $ | 1.27 | ||||||
| Weighted average common shares outstanding: |
||||||||||||
| Basic |
38,899 | 38,848 | 38,851 | |||||||||
| Diluted |
39,035 | 39,162 | 38,978 | |||||||||
See accompanying notes to consolidated financial statements.
F-4
MARCUS & MILLICHAP, INC.
CONSOLIDATED STATEMENT OF STOCKHOLDERS’ EQUITY
(dollar amounts in thousands)
| Series A Redeemable Preferred Stock |
Common Stock | Additional Paid-In Capital |
Stock Notes Receivable From Employees |
Retained Earnings (Accumulated Deficit) |
Accumulated Other Comprehensive Income |
Total | ||||||||||||||||||||||||||||||
| Shares | Amount | Shares | Amount | |||||||||||||||||||||||||||||||||
| Balance as of December 31, 2013 |
— | $ | — | 36,600,897 | $ | 4 | $ | 70,445 | $ | (13 | ) | $ | (7,939 | ) | $ | — | $ | 62,497 | ||||||||||||||||||
| Net and comprehensive income |
— | — | — | — | — | — | 49,531 | 159 | 49,690 | |||||||||||||||||||||||||||
| Stock-based award activity |
||||||||||||||||||||||||||||||||||||
| Stock-based compensation |
— | — | — | — | 5,034 | — | — | — | 5,034 | |||||||||||||||||||||||||||
| Issuance of common stock pursuant to employee stock purchase plan |
— | — | 25,331 | — | 410 | — | — | — | 410 | |||||||||||||||||||||||||||
| Issuance of common stock for settlement of deferred stock units |
— | — | 455,151 | — | — | — | — | — | — | |||||||||||||||||||||||||||
| Issuance of common stock for unvested restricted stock awards |
— | — | 22,884 | — | — | — | — | — | — | |||||||||||||||||||||||||||
| Shares withheld related to net share settlement of stock-based awards |
— | — | (185,821 | ) | — | (5,981 | ) | — | — | — | (5,981 | ) | ||||||||||||||||||||||||
| Windfall tax benefit from stock-based award activity |
— | — | — | — | 4,310 | — | — | — | 4,310 | |||||||||||||||||||||||||||
| Tax benefit of deductible IPO transaction costs |
— | — | — | — | 840 | — | — | — | 840 | |||||||||||||||||||||||||||
| Payments on stock notes receivable from employees |
— | — | — | — | — | 9 | — | — | 9 | |||||||||||||||||||||||||||
|
|
|
|
|
|
|
|
|
|
|
|
|
|
|
|
|
|
|
|||||||||||||||||||
| Balance as of December 31, 2014 |
— | — | 36,918,442 | 4 | 75,058 | (4 | ) | 41,592 | 159 | 116,809 | ||||||||||||||||||||||||||
| Net and comprehensive income |
— | — | — | — | — | — | 66,350 | 298 | 66,648 | |||||||||||||||||||||||||||
| Stock-based award activity |
||||||||||||||||||||||||||||||||||||
| Stock-based compensation |
— | — | — | — | 7,114 | — | — | — | 7,114 | |||||||||||||||||||||||||||
| Issuance of common stock pursuant to employee stock purchase plan |
— | — | 34,152 | — | 976 | — | — | — | 976 | |||||||||||||||||||||||||||
| Issuance of common stock for settlement of deferred stock units |
— | — | 455,151 | — | — | — | — | — | — | |||||||||||||||||||||||||||
| Issuance of common stock for vesting of restricted stock units |
— | — | 195,830 | — | — | — | — | — | — | |||||||||||||||||||||||||||
| Issuance of common stock for unvested restricted stock awards |
— | — | 10,110 | — | — | — | — | — | — | |||||||||||||||||||||||||||
| Shares withheld related to net share settlement of stock-based awards |
— | — | (217,229 | ) | — | (8,730 | ) | — | — | — | (8,730 | ) | ||||||||||||||||||||||||
| Windfall tax benefit from stock-based award activity |
— | — | — | — | 6,173 | — | — | — | 6,173 | |||||||||||||||||||||||||||
|
|
|
|
|
|
|
|
|
|
|
|
|
|
|
|
|
|
|
|||||||||||||||||||
| Balance as of December 31, 2015 |
— | — | 37,396,456 | 4 | 80,591 | (4 | ) | 107,942 | 457 | 188,990 | ||||||||||||||||||||||||||
| Net and comprehensive income |
— | — | — | — | — | — | 64,657 | 353 | 65,010 | |||||||||||||||||||||||||||
| Stock-based award activity |
||||||||||||||||||||||||||||||||||||
| Stock-based compensation |
— | — | — | — | 7,035 | — | — | — | 7,035 | |||||||||||||||||||||||||||
| Issuance of common stock pursuant to employee stock purchase plan |
— | — | 30,080 | — | 673 | — | — | — | 673 | |||||||||||||||||||||||||||
| Issuance of common stock for settlement of deferred stock units |
— | — | 435,026 | — | — | — | — | — | — | |||||||||||||||||||||||||||
| Issuance of common stock for vesting of restricted stock units |
— | — | 231,971 | — | — | — | — | — | — | |||||||||||||||||||||||||||
| Issuance of common stock for unvested restricted stock awards |
— | — | 14,742 | — | — | — | — | — | — | |||||||||||||||||||||||||||
| Shares withheld related to net share settlement of stock-based awards |
— | — | (226,009 | ) | — | (5,565 | ) | — | — | — | (5,565 | ) | ||||||||||||||||||||||||
| Windfall tax benefit from stock-based award activity |
— | — | — | — | 2,711 | — | — | — | 2,711 | |||||||||||||||||||||||||||
|
|
|
|
|
|
|
|
|
|
|
|
|
|
|
|
|
|
|
|||||||||||||||||||
| Balance as of December 31, 2016 |
— | $ | — | 37,882,266 | $ | 4 | $ | 85,445 | $ | (4 | ) | $ | 172,599 | $ | 810 | $ | 258,854 | |||||||||||||||||||
|
|
|
|
|
|
|
|
|
|
|
|
|
|
|
|
|
|
|
|||||||||||||||||||
See accompanying notes to consolidated financial statements.
F-5
MARCUS & MILLICHAP, INC.
CONSOLIDATED STATEMENTS OF CASH FLOWS
(dollar amounts in thousands)
| Year Ended December 31, | ||||||||||||
| 2016 | 2015 | 2014 | ||||||||||
| Cash flows from operating activities |
||||||||||||
| Net income |
$ | 64,657 | $ | 66,350 | $ | 49,531 | ||||||
| Adjustments to reconcile net income to net cash provided by operating activities: |
||||||||||||
| Depreciation and amortization expense |
4,387 | 3,305 | 3,206 | |||||||||
| Provision for bad debt expense |
47 | 281 | 29 | |||||||||
| Stock-based compensation |
7,035 | 7,114 | 5,034 | |||||||||
| Deferred taxes, net |
(483 | ) | 65 | 877 | ||||||||
| Net realized losses (gains) on marketable securities, available-for-sale |
123 | (132 | ) | — | ||||||||
| Tax benefit from stock-based award activity |
2,711 | 10,483 | — | |||||||||
| Excess tax benefit from stock-based award activity |
(2,711 | ) | (10,483 | ) | — | |||||||
| Other non-cash items |
444 | 509 | 372 | |||||||||
| Changes in operating assets and liabilities: |
||||||||||||
| Commissions receivable |
(1,467 | ) | 70 | (174 | ) | |||||||
| Prepaid expenses |
(552 | ) | (6 | ) | (3,216 | ) | ||||||
| Prepaid rent |
(4,210 | ) | (5,430 | ) | 1,354 | |||||||
| Assets held in rabbi trust |
(1,263 | ) | (1,514 | ) | (48 | ) | ||||||
| Other assets |
(803 | ) | (8,027 | ) | (1,243 | ) | ||||||
| Accounts payable and accrued expenses |
964 | (912 | ) | 2,302 | ||||||||
| Income tax receivable (payable) |
2,867 | (6,649 | ) | (3,860 | ) | |||||||
| Accrued bonuses and other employee related expenses |
(8,218 | ) | 3,261 | 10,846 | ||||||||
| Deferred compensation and commissions |
10,988 | 12,360 | 8,382 | |||||||||
| Deferred rent obligation and other liabilities |
(30 | ) | 1,475 | (1,955 | ) | |||||||
|
|
|
|
|
|
|
|||||||
| Net cash provided by operating activities |
74,486 | 72,120 | 71,437 | |||||||||
| Cash flows from investing activities |
||||||||||||
| Purchases of marketable securities, available-for-sale |
(107,898 | ) | (146,050 | ) | (14,700 | ) | ||||||
| Proceeds from sales and maturities of marketable securities, available-for-sale |
137,593 | 26,142 | — | |||||||||
| Payments received on employee notes receivable |
12 | 22 | 126 | |||||||||
| Issuances of employee notes receivable |
(455 | ) | (247 | ) | (86 | ) | ||||||
| Purchase of property and equipment |
(9,473 | ) | (6,796 | ) | (2,566 | ) | ||||||
| Proceeds from sale of property and equipment |
40 | — | 1 | |||||||||
|
|
|
|
|
|
|
|||||||
| Net cash provided by (used in) investing activities |
19,819 | (126,929 | ) | (17,225 | ) | |||||||
| Cash flows from financing activities |
||||||||||||
| Proceeds from issuance of shares pursuant to employee stock purchase plan |
673 | 976 | 410 | |||||||||
| Taxes paid related to net share settlement of stock-based awards |
(5,565 | ) | (8,730 | ) | (5,982 | ) | ||||||
| Excess tax benefit from stock-based award activity |
2,711 | 10,483 | — | |||||||||
| Realized tax benefit of deductible IPO transaction costs |
— | — | 840 | |||||||||
| Distribution related to stock appreciation rights liability |
— | — | (412 | ) | ||||||||
| Payments on obligations under capital leases |
— | — | (16 | ) | ||||||||
| Principal payments on notes payable to former stockholders |
(938 | ) | (894 | ) | (851 | ) | ||||||
| Payments received on stock notes receivable from employees |
— | — | 6 | |||||||||
|
|
|
|
|
|
|
|||||||
| Net cash (used in) provided by financing activities |
(3,119 | ) | 1,835 | (6,005 | ) | |||||||
| Net increase (decrease) in cash and cash equivalents |
91,186 | (52,974 | ) | 48,207 | ||||||||
| Cash and cash equivalents at beginning of year |
96,185 | 149,159 | 100,952 | |||||||||
|
|
|
|
|
|
|
|||||||
| Cash and cash equivalents at end of year |
$ | 187,371 | $ | 96,185 | $ | 149,159 | ||||||
|
|
|
|
|
|
|
|||||||
| Supplemental disclosures of cash flow information |
||||||||||||
| Interest paid during the period |
$ | 628 | $ | 868 | $ | 635 | ||||||
|
|
|
|
|
|
|
|||||||
| Income taxes paid, net |
$ | 37,350 | $ | 43,120 | $ | 35,596 | ||||||
|
|
|
|
|
|
|
|||||||
| Supplemental disclosures of noncash investing and financing activities |
||||||||||||
| Reduction of accrued bonuses and other employee related expenses in settlement of employee notes receivable |
$ | 325 | $ | 208 | $ | — | ||||||
|
|
|
|
|
|
|
|||||||
| Property and equipment additions incurred but not yet paid included in accounts payable and accrued expenses |
$ | 34 | $ | 462 | $ | (134 | ) | |||||
|
|
|
|
|
|
|
|||||||
| Settlements of deferred compensation obligation with trust assets |
$ | — | $ | 37 | $ | — | ||||||
|
|
|
|
|
|
|
|||||||
| Tax benefit from share-based award activity included in income tax receivable |
$ | — | $ | — | $ | 4,310 | ||||||
|
|
|
|
|
|
|
|||||||
See accompanying notes to consolidated financial statements.
F-6
Marcus & Millichap, Inc.
Notes to Consolidated Financial Statements
| 1. | Description of Business and Basis of Presentation |
Description of Business
Marcus & Millichap, Inc., (the “Company”, “Marcus & Millichap”, or “MMI”), a Delaware corporation, is a brokerage firm specializing in commercial real estate investment sales, financing, research and advisory services. As of December 31, 2016, MMI operates 82 offices in the United States and Canada through its wholly-owned subsidiary, Marcus & Millichap Real Estate Investment Services, Inc. (“MMREIS”), which includes the operations of Marcus & Millichap Capital Corporation (“MMCC”).
Reorganization and Initial Public Offering
MMI was formed in June 2013 in preparation for Marcus & Millichap Company (“MMC”) to spin-off its majority owned subsidiary, MMREIS (“Spin-Off”). Prior to the initial public offering (“IPO”) of MMI, all of the preferred and common stockholders of MMREIS (including MMC and employees of MMREIS) contributed all of their outstanding shares to MMI, in exchange for new MMI common stock. As a result, MMREIS became a wholly-owned subsidiary of MMI. Thereafter, MMC distributed 80.0% of the shares of MMI common stock to MMC’s shareholders and exchanged the remaining portion of its shares of MMI common stock for cancellation of indebtedness of MMC. MMI completed its IPO on October 30, 2013.
Basis of Presentation
The Company’s consolidated financial statements have been prepared in accordance with U.S. generally accepted accounting principles (“GAAP”). The consolidated financial statements include the accounts of the Company and its wholly owned subsidiaries. All significant intercompany balances and transactions have been eliminated in consolidation.
Reclassifications
Certain prior-period amounts in the consolidated financial statements and notes thereto, have been reclassified to conform to the current period presentation. These changes had no impact on the previously reported consolidated results of operations, total assets, total liabilities, stockholders’ equity or cash flow subtotals.
| 2. | Accounting Policies |
Cash and Cash Equivalents
The Company considers cash and cash equivalents to include short-term, highly liquid investments with maturities of three months or less when purchased. At December 31, 2016 and 2015, portions of the balance of cash and cash equivalents were held in four financial institutions, various money market funds and, in 2016, short-term commercial paper. In connection with regulatory changes effective October 2016, while still considered cash equivalents, certain money market funds have floating net asset values and may be subject to gating or liquidity fees. Management believes the likelihood of realizing material losses from the excess of cash balances over federally insured limits is remote.
Revenue Recognition
The Company generates real estate brokerage commissions by acting as a broker for real estate owners or investors seeking to buy or sell commercial properties. Revenues from real estate brokerage commissions are recognized when there is persuasive evidence of an arrangement, all services have been provided, the price is
F-7
Marcus & Millichap, Inc.
Notes to Consolidated Financial Statements
fixed and determinable and collectability is reasonably assured. These criteria are typically met at the close of escrow. The Company generates financing fees from securing financing on purchase transactions as well as fees earned from refinancing its clients’ existing mortgage debt and other financing activities. Revenues from financing fees are recognized at the time the loan closes and there are no remaining significant obligations for performance in connection with the transaction. Other revenues include fees generated from consulting and advisory services, as well as referral fees from other real estate brokers. Revenues from these services are recognized when the services are provided or upon closing of the transaction.
Commissions Receivable
Commissions receivable consists of commissions earned on brokerage transactions for which payment has not yet been received. The Company evaluates the need for an allowance for doubtful accounts based on the specific-identification of potentially uncollectible accounts. The majority of commissions receivable are settled within 10 days after the close of escrow. As a result, the Company did not require an allowance for commissions receivable at December 31, 2016 and 2015.
Cost of Services
Cost of services principally consists of commissions and other costs for the Company’s investment sales and financing professionals related to transactions closed in the period. Investment sales and financing professionals’ commissions are generally accrued based on revenue from transactions generated by the Company’s investment sales and financing professionals. Investment sales and financing professionals are compensated at commission rates based on individual agreements and a portion of the commissions due upon the closing of a transaction may be deferred in accordance with their contracts.
Investments in Marketable Securities, Available-for-Sale
The Company maintains a portfolio of investments in a variety of fixed and variable rate debt securities, including U.S. treasuries, U.S. government sponsored entities, corporate debt securities, asset-backed securities and other. The Company considers its investment in marketable securities to be available-for-sale. Accordingly, these investments are recorded at their fair values, with unrealized gains or losses recorded in other comprehensive income (loss), net of tax. The Company determines the appropriate classification of investments in marketable securities at the time of purchase. Interest along with accretion and amortization of purchase premiums and discounts, which are recorded over the remaining weighted average life of the security, are included in other income (expense), net in the consolidated statements of net and comprehensive income. See Note 5 – “Investments in Marketable Securities” for additional information.
The Company regularly reviews its investment portfolio to determine if any security is other-than-temporarily impaired, which would require the Company to record an impairment charge in the period any such determination is made. In making this judgment, the Company evaluates, among other items, the time frame and extent to which the fair market value of a security is less than its amortized cost and the Company’s intent and ability to sell, or whether the Company will more likely than not be required to sell, the security before recovery of its amortized cost basis. The Company has evaluated its investments in marketable securities as of December 31, 2016 and has determined that no investments with unrealized losses are other-than-temporarily impaired. The Company has no current intent to sell and it is not more likely than not that the Company will be required to sell these investments before recovery of their amortized cost basis, which may be at maturity. The Company may sell certain of its marketable securities, available-for-sale prior to their stated maturities for strategic reasons including, but not limited to, anticipation of credit deterioration, duration management, liquidity management and when a security no longer meets the criteria of the Company’s investment policy.
F-8
Marcus & Millichap, Inc.
Notes to Consolidated Financial Statements
Assets Held in Rabbi Trust
The Company provides a non-qualified deferred compensation program to certain employees. Deferred amounts are invested in variable whole life insurance policies owned by the Company for the participants benefit and held in a Rabbi Trust. Participants elect to invest in various equity and debt securities offered within the plan on a notional basis. The net change in the carrying value of the underlying assets held in the Rabbi Trust is recorded in other income (expense), net. The change in the deferred compensation liability as a result the change in the notional value of the participants accounts is recorded as a component of selling general and administrative expenses in the consolidated statements of net and comprehensive income.
Recurring Fair Value Measurements
The Company carries its investments including commercial paper and floating NAV money market funds recorded in cash and cash equivalents, investments in marketable securities, available-for-sale and assets held in the Rabbi Trust at fair value. The Company defines the fair value of a financial instrument as the amount that would be received from the sale of an asset in an orderly transaction between market participants at the measurement date. The Company is responsible for the determination of the value of the investment carried and fair value and the supporting methodologies and assumptions. The Company uses various pricing sources to validate the values utilized.
The degree of judgment used in measuring the fair value of financial instruments generally inversely correlates with the level of observable valuation inputs. Financial instruments with quoted prices in active markets generally have more pricing observability and less judgment is used in measuring fair value. Financial instruments for which no quoted prices are available have less observability and are measured at fair value using valuation models or other pricing techniques that require more judgment.
Assets recorded at fair value in the consolidated balance sheets are measured and classified in accordance with a fair value hierarchy consisting of the three “levels” based on the observability of inputs available in the marketplace used to measure the fair values as discussed below:
| • | Level 1: Unadjusted quoted prices in active markets that are accessible at the measurement date for identical, unrestricted assets or liabilities; |
| • | Level 2: Quoted prices in markets that are not active, or inputs which are observable, either directly or indirectly, for substantially the full term of the asset or liability, or |
| • | Level 3: Inputs reflect management’s best estimate of what market participants would use in pricing the asset or liability at the measurement date. Consideration is given to the risk inherent in the valuation technique and the risk inherent in the inputs to the model. |
Investment in marketable securities, available-for-sale and assets held in the Rabbi Trust are carried at fair value based on observable inputs available. All these securities are measured as Levels 1 or 2 as appropriate. The Company has no investments measured as Level 3.
Assets and Liabilities not Measured at Fair Value
The Company’s cash and cash equivalents held in financial institutions, commissions receivable, amounts due from employees and investment sales and financing professionals (included in other assets, net current caption and other assets non-current captions), accounts payable and accrued expenses and commissions payable
F-9
Marcus & Millichap, Inc.
Notes to Consolidated Financial Statements
are carried at cost, which approximates fair value based on their immediate or short-term maturities and terms which approximate current market rates, or for money market funds, quoted market rates, and are considered to be in the Level 1 classification.
The Company’s obligations under notes payable to former stockholders bear fixed interest rates. The Company has determined that the carrying value on these instruments approximates fair value. As the Company’s obligations under stock appreciation rights (“SARs”) liability (included in deferred compensation and commission’s caption) bear interest at a variable rate based on U.S. Treasuries, the Company has determined that the carrying value approximates the fair value.
Property and Equipment, Net
Property and equipment are stated at cost less accumulated depreciation and amortization. The Company uses the straight-line method for depreciation and amortization. Depreciation and amortization are generally provided over estimated useful lives ranging from three to seven years.
The Company evaluates its fixed assets for impairment whenever events or changes in circumstances indicate that the carrying amount of an asset may not be recoverable.
Other Assets
Other assets consist primarily of amounts due from the Company’s investment sales and financing professionals, security deposits made in connection with operating leases, customer trust accounts, employee notes receivable and other receivables.
The Company, from time to time, advances funds to its investment sales and financing professionals. Certain amounts may bear a nominal interest rate, with any cash receipts on notes applied first to any unpaid principal balance prior to any income being recognized. The Company generally has the ability to collect a portion of these amounts from future commissions due to the investment sales and financing professional. The Company may forgive a portion of the amount over time depending on the nature of the advance generally ratably over a contracted service period. Amounts forgiven are charged to selling, general and administrative expense at the time the amounts are forgiven. The Company evaluates the need for an allowance for these amounts based on the specific identification of potentially uncollectible amounts and provides an allowance based on consideration of historical experience. Amounts are written off upon separation from the Company of the investment sales and financing professional as a service provider or when amounts are determined to be no longer collectable.
In connection with a brokerage transaction, the Company may need to, or be required to, hold cash in escrow for a transaction participant. These amount are deposited into separate customer trust accounts controlled by the Company. The amounts are included in current other assets, net with a corresponding liability included in accounts payable and accrued expenses, both in the consolidated balance sheets.
Leases
The Company leases all of its facilities under operating lease agreements. Lease agreements may contain periods of free rent or reduced rent or contain predetermined fixed increases in the minimum rent. The Company recognizes the minimum lease payments as rent expense on a straight-line basis over the noncancellable term of the lease. The Company records the difference between the amount charged to rent expense and the rent paid as a deferred rent obligation. The Company typically leases general purpose built-out office space, which reverts to
F-10
Marcus & Millichap, Inc.
Notes to Consolidated Financial Statements
the lessor upon termination of the lease. Any payments for improvements, net of incentives received, are recorded as prepaid rent. Prepaid rent is amortized using the straight-line method over the expected lease term as a charge to rent expense.
Advertising Costs
Advertising costs are expensed as incurred. Advertising costs are included in selling, general, and administrative expense in the accompanying consolidated statements of net and comprehensive income.
Advertising costs for the years ended December 31, 2016, 2015 and 2014 was $1.2 million, $1.1 million and $965,000, respectively.
Income Taxes
The Company accounts for income taxes under the asset and liability method. The Company recognizes deferred tax assets and liabilities for the future tax consequences attributable to (1) differences between the financial statement carrying amounts of existing assets and liabilities and their respective tax basis, and (2) operating losses and tax credit carryforwards. The Company measures existing deferred tax assets and liabilities using enacted tax rates expected to apply to taxable income in the years in which the Company expects to have temporary differences to be realized or settled. The Company recognizes in the provision for income taxes the effect on deferred tax assets and liabilities of a change in tax rates in the period that includes the enactment date. The Company periodically evaluates the deferred tax assets to assess whether it is likely that the deferred tax assets will be realized. In determining whether a valuation allowance is required, the Company considers the timing of deferred tax reversals, current year taxable income and historical performance. Valuation allowances are provided against deferred tax assets when it is more-likely-than-not that some portion or all of the deferred tax asset will not be realized.
Because of the nature of the Company’s business, which includes activity in the U.S. and Canada, incorporating numerous states and provinces as well as local jurisdictions, the Company’s tax position can be complex. As such, the Company’s effective tax rate is subject to changes as a result of changes in the mix of its activity in the various jurisdictions in which the Company operates including changes in tax rates, state apportionment, tax related interest and penalties, valuation allowances and other permanent items.
The threshold for recognizing the benefits of tax return positions in the financial statements is “more likely than not” to be sustained by the taxing authority and requires measurement of a tax position meeting the more-likely-than-not criterion, based on the largest benefit that is more than 50% likely to be realized. The Company’s inventory of tax positions has been assessed with respect to all applicable income tax issues for all open tax years (in each respective jurisdiction), and has concluded that no uncertain tax positions are required to be recognized in the Company’s consolidated financial statements.
The Company recognizes interest and penalties incurred as income tax expense.
Stock-Based Compensation
The Company follows the accounting guidance for share based payments which requires the measurement and recognition of compensation expense for all stock based awards made to employees, independent contractors and non-employee directors. Awards are issued under the 2013 Omnibus Equity Incentive Plan (the “2013 Plan”) and 2013 Employee Stock Purchase Plan (“2013 ESPP Plan”).
F-11
Marcus & Millichap, Inc.
Notes to Consolidated Financial Statements
For awards made to the Company’s employees and directors, the Company initially values restricted stock units and restricted stock awards based on the grant date closing price of the Company’s common stock. For awards with periodic vesting, the Company recognizes the related expense on a straight-line basis over the requisite service period for the entire award, subject to periodic adjustments to ensure that the cumulative amount of expense recognized through the end of any reporting period is at least equal to the portion of the grant date value of the award that has vested through that date.
For awards made to independent contractors, which are the Company’s investment sales and financing professionals, the Company determined that the fair value of the award shall be measured based on the fair value of the equity instrument as it is more reliably measureable than the fair value of the consideration received. The Company uses the grant date as the performance commitment date, and the measurement date for these awards is the date the services are completed, which is the vesting date. As a result, the Company records stock-based compensation for these awards over the vesting period on a straight-line basis with periodic adjustments during the vesting period for changes in the fair value of the awards.
For the above awards, the Company estimates forfeitures at the time of grant in order to estimate the amount of share-based payment awards ultimately expected to vest and adjusts the recorded expense accordingly. The Company calculates a separate forfeiture rate for awards to its employees and independent contractors. Forfeitures are required to be revised, if necessary, in subsequent periods. If estimated and actual forfeitures differ from these initial estimates, the Company adjusts the cumulative expense as appropriate to account for the change in the estimated forfeiture rates. After adoption of ASU 2016-09, the Company will account for forfeitures as they occur.
If there are any modifications or cancellations of the underlying unvested share-based awards, the Company may be required to accelerate, increase or cancel any remaining unrecognized or previously recorded stock-based compensation expense.
For awards issued under the 2013 ESPP Plan, the Company determined that the plan was a compensatory plan and is required to expense the fair value of the awards over each six-month offering period. The Company estimates the fair value of these awards using the Black-Scholes option pricing model. The Company calculates the expected volatility based on the historical volatility of the Company’s common stock and the risk-free interest rate based on the U.S. Treasury yield curve in effect at the time of grant, both consistent with the term of the offering period. The Company incorporates no forfeiture rate and includes no expected dividend yield as the Company has not, and currently does not intend to pay a regular dividend.
Earnings per Share
Basic weighted average shares outstanding includes vested, but un-issued, Deferred Stock Units (“DSU’s). The difference between basic and diluted weighted average shares outstanding represents the dilutive impact of common stock equivalents consisting of shares to be issued under the 2013 Plan and 2013 ESPP Plan.
Foreign Currency Translation
The Company prepares the financial statements of its Canadian subsidiary using the local currency as the functional currency. The assets and liabilities of the Company’s Canadian subsidiary are translated in to U.S. dollars at the rates of exchange at the balance sheet date with the resulting translation adjustments included as a separate component of stockholder’s equity through other comprehensive income (loss) in the consolidated statements of net and comprehensive income.
F-12
Marcus & Millichap, Inc.
Notes to Consolidated Financial Statements
Income and expenses are translated at the average monthly rates of exchange. The Company includes gains and losses from foreign currency transactions in other income (expense), net in the consolidated statements of net and comprehensive income.
The effect of foreign currency translation on cash and cash equivalents is reflected in cash flows from operating activities on the consolidated statements of cash flows, and is not material for any period presented.
Taxes Collected From Clients and Remitted to Governmental Authorities
The Company accounts for tax assessed by any governmental authority that is based on revenue or transaction value (i.e. sales, use and value added taxes) on a net basis, and, accordingly, such amounts are not included in revenue. Collected amounts are recorded as a current liability until paid.
Use of Estimates
The preparation of consolidated financial statements in conformity with GAAP requires management to make estimates and assumptions that affect the reported amounts of assets and liabilities and the related disclosures at the date of the consolidated financial statements and the reported amounts of revenues and expenses during the reporting periods. Actual results could differ from those estimates.
Concentration of Credit Risk
Financial instruments that potentially subject the Company to a concentration of credit risk principally consist of cash and cash equivalents, due from independent contractors, investments in marketable securities, available-for-sale, security deposits (included under other assets, non-current caption) and commissions receivables. Cash and cash equivalents are placed with high-credit quality financial institutions and invested in high-credit quality money market funds and commercial paper.
To reduce its credit risk, the Company monitors the credit standing of the financial institutions that hold the Company’s cash and cash equivalents. The Company historically has not experienced any losses related to cash and cash equivalents.
The Company derives its revenues from a broad range of real estate investors, owners, and users in the United States and Canada, none of which individually represents a significant concentration of credit risk. The Company requires collateral on a case-by-case basis. The Company maintains allowances, as needed, for estimated credit losses based on management’s assessment of the likelihood of collection. For the twelve months ended December 31, 2016, 2015 and 2014, no transaction represented 10% or more of total revenues. Further, while one or more transactions may represent 10% or more of commissions receivable at any reporting date, amounts due are typically collected within 10 days of settlement and therefore do not expose the Company to significant credit risk.
No office represented 10% or more of total revenues during the twelve months ended December 31, 2016, 2015 and 2014.
Segment Reporting
The Company follows the guidance for segment reporting, which requires reporting information on operating segments in interim and annual financial statements. An operating segment is defined as a component of an enterprise that engages in business activities from which it may earn revenues and incur expenses whose
F-13
Marcus & Millichap, Inc.
Notes to Consolidated Financial Statements
separate financial information is available and is evaluated regularly by the Chief Operating Decision Maker (“CODM”) or decision making group, to perform resource allocations and performance assessments. The CODMs are the Chief Executive Officer, Chief Operating Officer and Chief Financial Officer. The CODMs review aggregated financial information presented on an office-by-office basis for purposes of making operating decisions, assessing financial performance and allocating resources. Based on the evaluation of the Company’s financial information, management believes that the Company’s offices represent individual operating segments with similar economic characteristics that meet the criteria for aggregation into a single reportable segment for financial reporting purposes.
Recent Accounting Pronouncements
Adopted
In August 2014, the FASB issued ASU No. 2014-15, Disclosure of Uncertainties about an Entity’s Ability to Continue as a Going Concern (“ASU 2014-15”). Previously, there was no guidance under U.S. GAAP regarding management’s responsibility to assess whether there is substantial doubt about an entity’s ability to continue as a going concern. Under ASU 2014-15, the Company is required to assess its ability to continue as a going concern each interim and annual reporting period and provide certain disclosures if there is substantial doubt about the entity’s ability to continue as a going concern, including management’s plan to alleviate the substantial doubt. ASU 2014-15 is effective for reporting periods ending after December 15, 2016 and early adoption is permitted. The Company adopted ASU 2014-15 as of December 31, 2016. The adoption did not have an impact on the Company’s consolidated financial position or result of operations.
In August 2016, the FASB issued ASU No. 2016-15, Classification of Certain Cash Receipts and Cash Payments (“ASU 2016-15”), to reduce diversity in practice in the classification of cash activity related to eight specific areas. ASU 2016-15 is effective for reporting periods beginning after December 15, 2017 and interim periods within those years and early adoption is permitted. The Company adopted ASU 2016-15 as of December 31, 2016. The Company evaluated the impact of this new standard and determined its historical classifications, where applicable, were in accordance with ASU 2016-15. Accordingly, the adoption did not have an impact on the Company’s consolidated statement of cash flows.
Pending Adoption
In March 2016, the FASB issued ASU No. 2016-09, Improvements to Employee Share-Based Payment Accounting (“ASU 2016-09”). ASU 2016-09 changes the accounting for share-based payment awards issued to employees. ASU 2016-09 is effective for reporting periods beginning after December 15, 2016 and early adoption is permitted. For the Company, the new standard will be effective on January 1, 2017 and the Company will adopt the provisions of ASU 2016-09 as of January 1, 2017. The Company will adopt the provisions of ASU 2016-09 on a prospective basis except for the change in the accounting for forfeitures, where the Company will adopt the provision on a modified retrospective basis with a cumulative-effect adjustment as of January 1, 2017.
As a result of the adoption, in periods subsequent to December 31, 2016, any windfall tax benefits will be recorded as a discrete item in the Company’s provision for income taxes, and therefore, will impact net and comprehensive income and related earnings per share amounts. Prior to the adoption, any windfall tax benefits were recorded in additional paid in capital. Additionally, in periods subsequent to December 31, 2016, excess tax benefits for share-based payments will be included in cash flow from operating activities rather than cash flows from financing activities. Further, the Company will change its accounting for forfeitures from estimating awards that are not expected to vest to recording forfeitures when they actually occur. The cumulative effect adjustment as of January 1, 2017 related to forfeitures will be a charge to retained earnings of approximately $52,000 (net of
F-14
Marcus & Millichap, Inc.
Notes to Consolidated Financial Statements
tax) and will have a minor impact on the timing of stock based compensation subsequent to January 1, 2017. See Note 10 – “Stock-Based Compensation Plans” for additional information.
In May 2014, the Financial Accounting Standards Board (“FASB”) issued Accounting Standards Update (“ASU”) No. 2014-09, Revenue from Contracts with Customers (“ASU 2014-09”), which supersedes virtually all of the current revenue recognition guidance under U.S. GAAP, and requires entities to recognize revenue for transfer to customer of promised goods or services in an amount that reflects the consideration to which the entity expects to be entitled to receive in exchange for those goods or services. Subsequent to the issuance of ASU 2014-09, the FASB issued ASU No. 2015-14, Revenue from Contracts with Customers (Topic 606): Deferral of the Effective Date, ASU No. 2016-08, Revenue from Contacts with Customers: Principal Versus Agent Considerations, ASU No. 2016-10, Revenue from Contracts with Customers: Identifying Performance Obligations and Licensing, and ASU No. 2016-12, Revenue from Contracts with Customers: Narrow-Scope Improvements and Practical Expedients. The additional ASU’s clarified certain provisions of ASU 2014-09 in response to recommendations from the Transition Resources Group established by the FASB and extended the required adoption of ASU 2014-09 which is now effective for reporting periods beginning after December 15, 2017 and early adoption is permitted as of the original effective date.
ASU 2014-09 permits two implementation approaches, one requiring retrospective application of the new standard with restatement of prior years and one requiring prospective application of the new standard with disclosure of results under old standards. For the Company, the new standard will be effective January 1, 2018. The Company does not have multiple-element arrangements, variable consideration, licenses or long-term contracts with customers. Accordingly, the adoption of ASU 2014-09, as clarified, will not have a significant effect in the manner or timing of its revenue recognition. As a result, the Company will not be required to select a transition method.
In February 2016, the FASB issued ASU No. 2016-02, Leases, to increase transparency and comparability by recognizing lease assets and lease liabilities on the balance sheet and disclosing key information about leasing arrangements. The Company is still evaluating the impact of the new standard. The Company will be required to adopt the new standard in 2019 and the Company’s consolidated balance sheets will be impacted by the recording of a lease liability and right of use asset for virtually all of its current operating leases. As of December 31, 2016, the Company has remaining contractual obligations for operating leases (autos and office), which aggregate approximately $76.3 million. Accordingly, we anticipate that the adoption of the new standard will have a material impact on the Company’s consolidated balance sheet. The amount of which and potential impact on the consolidated statements of net and comprehensive income and consolidated statements of cash flows has yet to be determined.
In June 2016, the FASB issued ASU No. 2016-13, Financial Instruments – Credit Losses (“ASU 2016-13”). ASU 2016-13 is effective for reporting periods beginning after December 15, 2019 and early adoption is permitted. For the Company, the new standard will be effective January 1, 2020. Under ASU 2016-13, the Company will be required to use an expected-loss model for its marketable securities, available-for sale, which requires that credit losses be presented as an allowance rather than as an impairment write-down. Reversals of credit losses (in situations in which the estimate of credit losses declines) is permitted in the reporting period the change occurs. Current U.S. GAAP prohibits reflecting reversals of credit losses in current period earnings. At December 31, 2016, the Company had $104.9 million in marketable securities, available for sale with an average credit rating of AA+, which would be subject to this new standard. The Company is currently evaluating the impact on its investment policy and investment position of this new standard.
In November 2016, the FASB issued ASU No. 2016-18, Statement of Cash Flows (Topic 230): Restricted Cash (“ASU 2016-18”). ASU 2016-18 requires that a statement of cash flows explain the change during the
F-15
Marcus & Millichap, Inc.
Notes to Consolidated Financial Statements
period in the total of cash, cash equivalents, and amounts generally described as restricted cash or restricted cash equivalents. Therefore, amounts generally described as restricted cash and restricted cash equivalents should be included with cash and cash equivalents when reconciling the beginning-of-period and end-of-period total amounts shown on the statement of cash flows. ASU 2016-18 will be effective beginning December 1, 2018 and early adoption is permitted. ASU 2016-18 is required to be applied using a retrospective transition method to each period presented. The Company is currently evaluating the potential impact on its consolidated financial statements of this new standard.
| 3. | Property and Equipment, Net |
Property and equipment, net consisted of the following (in thousands):
| December 31, | ||||||||
| 2016 | 2015 | |||||||
| Computer software and hardware equipment |
$ | 14,583 | $ | 10,973 | ||||
| Furniture, fixtures, and equipment |
20,066 | 17,047 | ||||||
| Less: accumulated depreciation and amortization |
(18,294 | ) | (16,441 | ) | ||||
|
|
|
|
|
|||||
| $ | 16,355 | $ | 11,579 | |||||
|
|
|
|
|
|||||
During the years ended December 31, 2016 and 2015, the Company wrote-off approximately $2.8 million and $2.7 million, respectively, of fully depreciated computer software and hardware and furniture, fixtures, and equipment.
| 4. | Selected Balance Sheet Data |
Other Assets
Other assets consisted of the following (in thousands):
| Current December 31, |
Non-Current December 31, |
|||||||||||||||
| 2016 | 2015 | 2016 | 2015 | |||||||||||||
| Due from independent contractors, net (1) (2) |
$ | 2,231 | $ | 2,545 | $ | 8,702 | $ | 7,358 | ||||||||
| Security deposits |
— | — | 1,059 | 1,425 | ||||||||||||
| Employee notes receivable (3) |
314 | 224 | 132 | 158 | ||||||||||||
| Customer trust accounts and other |
2,557 | 2,367 | 88 | 175 | ||||||||||||
|
|
|
|
|
|
|
|
|
|||||||||
| $ | 5,102 | $ | 5,136 | $ | 9,981 | $ | 9,116 | |||||||||
|
|
|
|
|
|
|
|
|
|||||||||
| (1) | Represents amounts advanced, notes receivable and other receivables due from the Company’s investment sales and financing professionals. The notes receivable along with interest, are typically collected from future commissions and are generally due in one to five years. As of December 31, 2016 and 2015, the weighted average interest rate for notes receivable due from the Company’s investment sales and financing professionals was approximately 3.3% and 2.9%, respectively. Any cash receipts on notes are applied first to unpaid principal balance prior to any income being recognized. |
| (2) | Includes allowance for doubtful accounts related to current receivables of $313 and $359 as of December 31, 2016 and 2015, respectively. The Company recorded a provision for bad debt expense of $47, $281 and $29 and wrote off $93, $115 and $59 of these receivables for the years ended December 31, 2016, 2015 and 2014, respectively. |
| (3) | See Note 7 – “Related-Party Transactions” for additional information. |
F-16
Marcus & Millichap, Inc.
Notes to Consolidated Financial Statements
Deferred Compensation and Commissions
Deferred compensation and commissions consisted of the following (in thousands):
| Current December 31, |
Non-Current December 31, |
|||||||||||||||
| 2016 | 2015 | 2016 | 2015 | |||||||||||||
| SARs liability (1) |
$ | 1,366 | $ | — | $ | 20,949 | $ | 21,399 | ||||||||
| Commissions payable to investment sales and financing professionals |
42,781 | 34,091 | 17,101 | 17,015 | ||||||||||||
| Deferred compensation liability (1) |
607 | — | 6,405 | 5,264 | ||||||||||||
|
|
|
|
|
|
|
|
|
|||||||||
| $ | 44,754 | $ | 34,091 | $ | 44,455 | $ | 43,678 | |||||||||
|
|
|
|
|
|
|
|
|
|||||||||
| (1) | The SARs and deferred compensation liability become subject to payout as a result of a participant no longer being considered as an employee service provider. As a result of the retirement of certain participants, estimated amounts to be paid to the participants within the next twelve months has been classified as current. |
SARs Liability
Prior to the IPO, certain employees of the Company were granted SARs under a stock-based compensation program assumed by MMC. In connection with the IPO, the SARs agreements were revised, the MMC liability of $20.0 million for the SARs was frozen at March 31, 2013, and was transferred to MMI through a capital distribution. The SARs liability will be settled with each participant in ten annual installments in January of each year upon retirement or termination from service. Under the revised agreements, MMI is required to accrue interest on the outstanding balance beginning on January 1, 2014 at a rate based on the 10-year treasury note plus 2%. The rate resets annually. The rates at January 1, 2016, 2015 and 2014 was 4.273%, 4.173% and 5.03%, respectively. MMI recorded interest expense related to this liability of $914,000, $857,000 and $984,000 for the years ended December 31, 2016, 2015 and 2014, respectively.
Estimated payouts within the next twelve months for participants that have separated from service have been classified as current.
Commissions Payable
Certain investment sales professionals have the ability to earn additional commissions after meeting certain annual revenue thresholds. These commissions are recognized as cost of services in the period in which they are earned as they relate to specific transactions closed. The Company has the ability to defer payment of certain commissions, at its election, for up to three years. Commissions payable that are not expected to be paid within twelve months are classified as long-term.
Deferred Compensation Liability
A select group of management is eligible to participate in a Deferred Compensation Plan. The plan is a 409A plan and permits the participant to defer compensation up to limits as determined by the plan. Amounts are paid out generally when the participant is no longer a service provider; however, an in-service payout election is available to participants. Participants may elect to receive payouts as a lump sum or quarterly over a two to
F-17
Marcus & Millichap, Inc.
Notes to Consolidated Financial Statements
fifteen year period. The Company elected to fund the Deferred Compensation Plan through company owned variable life insurance policies. The Deferred Compensation Plan is managed by a third-party institutional fund manager, and the deferred compensation and investment earnings are held as a Company asset in a Rabbi Trust, which is recorded in assets held in rabbi trust in the accompanying consolidated balance sheets. The assets in the trust are restricted unless the Company becomes insolvent, as defined in the Deferred Compensation Plan, in which case the trust assets are subject to the claims of MMI’s creditors. The Company may also, in its sole and absolute discretion, elect to withdraw at any time a portion of the trust assets in an amount by which the fair market value of the trust assets exceeds 110% of the aggregate deferred compensation liability represented by the participants’ accounts. Estimated payouts within the next twelve months for participants that have separated from service have been classified as current.
The net change in the carrying value of the assets held in the rabbi trust and the net change in the carrying value of the deferred compensation liability, each exclusive of additional contributions, distributions and trust expenses consisted of the following (in thousands):
| December 31, | ||||||||||||
| 2016 | 2015 | 2014 | ||||||||||
| Increase (decrease) in the carrying value of the assets held in the rabbi trust (1) |
$ | 470 | $ | (57 | ) | $ | 290 | |||||
|
|
|
|
|
|
|
|||||||
| Increase (decrease) in the carrying value of the deferred compensation obligation (2) |
$ | 452 | $ | (67 | ) | $ | 313 | |||||
|
|
|
|
|
|
|
|||||||
| (1) | Recorded in other income (expense), net in the consolidated statements of net and comprehensive income. |
| (2) | Recorded in selling, general and administrative expense in the consolidated statements of net and comprehensive income. |
| 5. | Investments in Marketable Securities |
Amortized cost and fair value of marketable securities, available-for-sale, by type of security consisted of the following (in thousands):
| December 31, 2016 | December 31, 2015 | |||||||||||||||||||||||||||||||
| Amortized Cost |
Gross Unrealized Gains |
Gross Unrealized Losses |
Fair Value |
Amortized Cost |
Gross Unrealized Gains |
Gross Unrealized Losses |
Fair Value |
|||||||||||||||||||||||||
| Short-term investments: |
||||||||||||||||||||||||||||||||
| U.S. treasuries |
$ | 24,987 | $ | — | $ | (30 | ) | $ | 24,957 | $ | 62,343 | $ | — | $ | (71 | ) | $ | 62,272 | ||||||||||||||
| U.S. government sponsored entities |
2,497 | — | — | 2,497 | 17,571 | — | (12 | ) | 17,559 | |||||||||||||||||||||||
| Asset-backed securities and other |
— | — | — | — | 29 | — | — | 29 | ||||||||||||||||||||||||
|
|
|
|
|
|
|
|
|
|
|
|
|
|
|
|
|
|||||||||||||||||
| $ | 27,484 | $ | — | $ | (30 | ) | $ | 27,454 | $ | 79,943 | $ | — | $ | (83 | ) | $ | 79,860 | |||||||||||||||
|
|
|
|
|
|
|
|
|
|
|
|
|
|
|
|
|
|||||||||||||||||
F-18
Marcus & Millichap, Inc.
Notes to Consolidated Financial Statements
| December 31, 2016 | December 31, 2015 | |||||||||||||||||||||||||||||||
| Amortized Cost |
Gross Unrealized Gains |
Gross Unrealized Losses |
Fair Value |
Amortized Cost |
Gross Unrealized Gains |
Gross Unrealized Losses |
Fair Value |
|||||||||||||||||||||||||
| Long-term investments: |
||||||||||||||||||||||||||||||||
| U.S. treasuries |
$ | 40,865 | $ | — | $ | (229 | ) | $ | 40,636 | $ | 15,283 | $ | — | $ | (112 | ) | $ | 15,171 | ||||||||||||||
| U.S. government sponsored entities |
12,618 | — | (58 | ) | 12,560 | 12,107 | — | (85 | ) | 12,022 | ||||||||||||||||||||||
| Corporate debt securities |
17,841 | 74 | (165 | ) | 17,750 | 17,219 | 5 | (519 | ) | 16,705 | ||||||||||||||||||||||
| Asset-backed securities and other |
6,557 | 18 | (46 | ) | 6,529 | 10,649 | — | (152 | ) | 10,497 | ||||||||||||||||||||||
|
|
|
|
|
|
|
|
|
|
|
|
|
|
|
|
|
|||||||||||||||||
| $ | 77,881 | $ | 92 | $ | (498 | ) | $ | 77,475 | $ | 55,258 | $ | 5 | $ | (868 | ) | $ | 54,395 | |||||||||||||||
|
|
|
|
|
|
|
|
|
|
|
|
|
|
|
|
|
|||||||||||||||||
The amortized cost and fair value of the Company’s investments in available-for-sale securities that have been in a continuous unrealized loss position consisted of the following (in thousands):
| December 31, 2016 | December 31, 2015 | |||||||||||||||
| Unrealized Loss |
Fair Value |
Unrealized Loss |
Fair Value |
|||||||||||||
| Less than 12 months |
$ | (491 | ) | $ | 86,105 | $ | (951 | ) | $ | 129,117 | ||||||
|
|
|
|
|
|
|
|
|
|||||||||
| 12 months or longer |
$ | (37 | ) | $ | 721 | $ | — | $ | — | |||||||
|
|
|
|
|
|
|
|
|
|||||||||
Gross realized gains and gross realized losses from the sales of the Company’s available-for-sale securities consisted of the following (in thousands):
| December 31, | ||||||||
| 2016 | 2015 | |||||||
| Gross realized gain (1) |
$ | 43 | $ | 135 | ||||
|
|
|
|
|
|||||
| Gross realized loss (1) |
$ | (166 | ) | $ | (3 | ) | ||
|
|
|
|
|
|||||
| (1) | Recorded in other income (expense), net in the consolidated statements of net and comprehensive income. The cost basis of securities sold were determined on the specific identification method. |
The Company may sell certain of its marketable securities, available-for-sale prior to their stated maturities for strategic reasons including, but not limited to, anticipation of credit deterioration, duration management, liquidity management and when a security no longer meets the criteria of the Company’s investment policy. During 2016, the Company sold one security, which no longer met the requirements of its investment policy for a loss of $152,000.
As of December 31, 2016, the Company considers the declines in market value of its marketable securities, available-for-sale to be temporary in nature and does not consider any of its investments other-than-temporarily impaired. The Company typically invests in highly-rated securities, and its investment policy generally limits the amount of credit exposure to any one issuer. The policy generally requires investments to be investment grade, with the primary objective of minimizing the potential risk of principal loss and matching long-term liabilities. When evaluating an investment for other-than-temporary impairment the Company reviews factors such as the length of time and extent to which fair value has been below its cost basis, the financial condition of the issuer
F-19
Marcus & Millichap, Inc.
Notes to Consolidated Financial Statements
and any changes thereto, changes in market interest rates and the Company’s intent to sell, or whether it is more likely than not it will be required to sell the investment before recovery of the investment’s cost basis.
Amortized cost and fair value of marketable securities, available-for-sale, by contractual maturity consisted of the following (in thousands):
| December 31, 2016 | December 31, 2015 | |||||||||||||||
| Amortized Cost |
Fair Value |
Amortized Cost |
Fair Value |
|||||||||||||
| Due in one year or less |
$ | 27,484 | $ | 27,454 | $ | 79,943 | $ | 79,860 | ||||||||
| Due after one year through five years |
57,309 | 57,144 | 28,634 | 28,465 | ||||||||||||
| Due after five years through ten years |
14,992 | 14,841 | 18,020 | 17,466 | ||||||||||||
| Due after ten years |
5,580 | 5,490 | 8,604 | 8,464 | ||||||||||||
|
|
|
|
|
|
|
|
|
|||||||||
| $ | 105,365 | $ | 104,929 | $ | 135,201 | $ | 134,255 | |||||||||
|
|
|
|
|
|
|
|
|
|||||||||
| Weighted average maturity |
3.5 years | 3.3 years | ||||||||||||||
Actual maturities may differ from contractual maturities because certain borrowers are required to make principal payments or have the right to prepay certain obligations with or without prepayment penalties.
| 6. | Notes Payable to Former Stockholders |
In conjunction with the Spin-Off and IPO, notes payable to certain former stockholders of MMREIS were issued in settlement of restricted stock and SARs awards that were redeemed by MMREIS upon the termination of employment by these former stockholders (“the Notes”). The Notes had been previously assumed by MMC, and were transferred to the Company. The Notes are unsecured and bear interest at 5% with annual principal and interest installments and a final principal payment due during the second quarter of 2020. During each of the years ended December 31, 2016 and 2015, the Company made total payments on the Notes, including interest, of $1.5 million.
Accrued interest included in accounts payable and accrued expenses in the accompanying consolidated balance sheets pertaining to the Notes consisted of the following (in thousands):
| December 31, | ||||||||
| 2016 | 2015 | |||||||
| Accrued interest |
$ | 337 | $ | 367 | ||||
|
|
|
|
|
|||||
Interest expense pertaining to the Notes consisted of the following (in thousands):
| Year Ended December 31, | ||||||||||||
| 2016 | 2015 | 2014 | ||||||||||
| Interest expense |
$ | 502 | $ | 548 | $ | 591 | ||||||
|
|
|
|
|
|
|
|||||||
F-20
Marcus & Millichap, Inc.
Notes to Consolidated Financial Statements
Future minimum principal payments on the Notes consisted of the following (in thousands):
| December 31, 2016 | ||||
| 2017 |
$ | 986 | ||
| 2018 |
1,035 | |||
| 2019 |
1,087 | |||
| 2020 |
6,564 | |||
| 2021 |
— | |||
|
|
|
|||
| $ | 9,672 | |||
|
|
|
|||
| 7. | Related-Party Transactions |
Shared and Transition Services
Prior to October 2013, the Company operated under a shared services arrangement with MMC whereby the Company was charged for actual costs specifically incurred on behalf of the Company or allocated to the Company on a pro rata basis. Beginning in October 2013, certain services are provided to the Company under a Transition Services Agreement (“TSA”) between MMC and the Company, which replaced the pre-IPO shared services arrangement. The TSA is intended to provide certain services until the Company acquires the services separately. During the years ended December 31, 2016, 2015 and 2014, the Company incurred $227,000, $257,000 and $1.3 million, respectively under the TSA of which $1.0 million was incurred for reimbursement of health insurance premiums for the year ended December 31, 2014. These amounts are included in selling, general and administrative expense in the accompanying consolidated statements of net and comprehensive income.
Brokerage and Financing Services with the Subsidiaries of MMC
MMC has wholly or majority owned subsidiaries that buy and sell commercial real estate properties. The Company performs certain brokerage and financing services related to transactions of the subsidiaries and affiliates of MMC. For the years ended December 31, 2016, 2015 and 2014, the Company recorded real estate brokerage commissions and financing fees of $5.1 million, $2.7 million and $1.3 million, respectively, from subsidiaries and affiliates of MMC related to these services. The Company incurred cost of services of $3.0 million, $1.6 million and $816,000, respectively, related to these revenues.
Operating Lease with MMC
The Company has an operating lease with MMC for a single story office building located in Palo Alto, California, which was amended in 2016 to extend the expiration date to May 31, 2022. Rent expense for this lease aggregated $1.0 million, $693,500 and $438,000 for the years ended December 31, 2016, 2015 and 2014, respectively. Rent expense is included in selling, general and administrative expense in the accompanying consolidated statements of net and comprehensive income.
Accounts Payable and Accrued Expenses with MMC
As of December 31, 2016 and 2015, $303,000 and $96,000, respectively, remains unpaid related to the operating lease with MMC and is included in accounts payable and accrued expenses in the accompanying consolidated balance sheets.
Other
The Company makes advances to non-executive employees from time-to-time. At December 31, 2016 and 2015, the aggregate principal amount for employee loans outstanding was $446,000 and $382,000, respectively, which is included in other assets, current and other assets non-current captions in the accompanying consolidated balance sheets.
F-21
Marcus & Millichap, Inc.
Notes to Consolidated Financial Statements
As of December 31, 2016, George M. Marcus, the Company’s founder and Co-Chairman, beneficially owned approximately 55% of the Company’s issued and outstanding common stock, including shares owned by Phoenix Investments Holdings, LLC (“Phoenix”), the George and Judy Marcus Family Foundation and The Marcus Family Foundation.
On February 6, 2015, the Company filed a shelf Registration Statement on Form S-3, registering for future sale 4,600,000 shares of common stock, including common stock beneficially owned by George M. Marcus. On March 18, 2015, a secondary offering of 4,000,000 shares closed at a price per share of $31.9925 and the underwriters exercised their option to purchase an additional 600,000. In connection with the offering, the Company incurred approximately $113,000 of costs, which were reimbursed by the selling stockholders.
| 8. | Fair Value Measurements |
Recurring Fair Value Measurements
The Company values its investments including assets held in rabbi trust, commercial paper, money market funds and investments in marketable securities, available-for-sale at fair value on a recurring basis. Fair values were determined for each individual security in the investment portfolio.
Assets carried at fair value are categorized into one of the three categories described in Note 2 – “Accounting Policies” and consisted of the following (in thousands):
| December 31, 2016 | December 31, 2015 | |||||||||||||||||||||||||||||||
| Fair Value | Level 1 | Level 2 | Level 3 | Fair Value | Level 1 | Level 2 | Level 3 | |||||||||||||||||||||||||
| Assets held in rabbi trust |
$ | 7,337 | $ | — | $ | 7,337 | $ | — | $ | 5,661 | $ | — | $ | 5,661 | $ | — | ||||||||||||||||
|
|
|
|
|
|
|
|
|
|
|
|
|
|
|
|
|
|||||||||||||||||
| Cash and cash equivalents: |
||||||||||||||||||||||||||||||||
| Cash |
$ | 34,881 | $ | 34,881 | $ | — | $ | — | $ | 90,198 | $ | 90,198 | $ | — | $ | — | ||||||||||||||||
| Commercial Paper |
9,987 | — | 9,987 | — | — | — | — | — | ||||||||||||||||||||||||
| Money market funds |
142,503 | 142,503 | — | — | 5,987 | 5,987 | — | — | ||||||||||||||||||||||||
|
|
|
|
|
|
|
|
|
|
|
|
|
|
|
|
|
|||||||||||||||||
| $ | 187,371 | $ | 177,384 | $ | 9,987 | $ | — | $ | 96,185 | $ | 96,185 | $ | — | $ | — | |||||||||||||||||
|
|
|
|
|
|
|
|
|
|
|
|
|
|
|
|
|
|||||||||||||||||
| Marketable securities, available-for-sale: |
||||||||||||||||||||||||||||||||
| Short-term investments: |
||||||||||||||||||||||||||||||||
| U.S. Treasuries |
$ | 24,957 | $ | 24,957 | $ | — | $ | — | $ | 62,272 | $ | 62,272 | $ | — | $ | — | ||||||||||||||||
| U.S. Government Sponsored Entities |
2,497 | — | 2,497 | — | 17,559 | — | 17,559 | — | ||||||||||||||||||||||||
| Asset-backed securities and other |
— | — | — | — | 29 | — | 29 | — | ||||||||||||||||||||||||
|
|
|
|
|
|
|
|
|
|
|
|
|
|
|
|
|
|||||||||||||||||
| $ | 27,454 | $ | 24,957 | $ | 2,497 | $ | — | $ | 79,860 | $ | 62,272 | $ | 17,588 | $ | — | |||||||||||||||||
|
|
|
|
|
|
|
|
|
|
|
|
|
|
|
|
|
|||||||||||||||||
| Long-term investments: |
||||||||||||||||||||||||||||||||
| U.S. Treasuries |
$ | 40,636 | $ | 40,636 | $ | — | $ | — | $ | 15,171 | $ | 15,171 | $ | — | $ | — | ||||||||||||||||
| U.S. Government Sponsored Entities |
12,560 | — | 12,560 | — | 12,022 | — | 12,022 | — | ||||||||||||||||||||||||
| Corporate debt securities |
17,750 | — | 17,750 | — | 16,705 | — | 16,705 | — | ||||||||||||||||||||||||
| Asset-backed securities and other |
6,529 | — | 6,529 | — | 10,497 | — | 10,497 | — | ||||||||||||||||||||||||
|
|
|
|
|
|
|
|
|
|
|
|
|
|
|
|
|
|||||||||||||||||
| $ | 77,475 | $ | 40,636 | $ | 36,839 | $ | — | $ | 54,395 | $ | 15,171 | $ | 39,224 | $ | — | |||||||||||||||||
|
|
|
|
|
|
|
|
|
|
|
|
|
|
|
|
|
|||||||||||||||||
See Note 2 – “Accounting Policies” for information on fair value of the Company’s other financial instruments.
F-22
Marcus & Millichap, Inc.
Notes to Consolidated Financial Statements
There were no transfers in or out of Level 1 and Level 2 during the year ended December 31, 2016.
| 9. | Stockholders’ Equity |
Common Stock
As of December 31, 2016 and 2015, there were 37,882,266 and 37,396,456 shares of common stock, $0.0001 par value, issued and outstanding, respectively. Such amounts include unvested restricted stock awards issued to non-employee directors. See Note 13 – “Earnings Per Share” for additional information.
Preferred Stock
The Company has 25,000,000 authorized shares of preferred stock with a par value $0.0001 per share. At December 31, 2016 and 2015, there were no preferred shares issued or outstanding.
Accumulated Other Comprehensive (Loss) Income
The components of accumulated other comprehensive (loss) income as of December 31, 2016, by component, net of income taxes consisted of the following (in thousands):
| Unrealized gains and (losses) of available- for-sale securities |
Foreign currency translation (2) |
Total | ||||||||||
| Beginning balance, December 31, 2015 |
$ | (568 | ) | $ | 1,025 | $ | 457 | |||||
| Other comprehensive (loss) income before reclassifications |
403 | 40 | 443 | |||||||||
| Amounts reclassified from accumulated other comprehensive (loss) income (1) |
(90 | ) | — | (90 | ) | |||||||
|
|
|
|
|
|
|
|||||||
| Net current-period other (loss) comprehensive income |
313 | 40 | 353 | |||||||||
|
|
|
|
|
|
|
|||||||
| Ending balance, December 31, 2016 |
$ | (255 | ) | $ | 1,065 | $ | 810 | |||||
|
|
|
|
|
|
|
|||||||
| (1) | Included as a component of other income (expense), net in the consolidated statements of net and comprehensive income. The reclassifications were determined on a specific identification basis. |
| (2) | Deferred taxes are not provided for the cumulative translation adjustment as the subsidiary has no earnings and profits. See Note 11 – “Income Taxes” for additional information. |
| 10. | Stock-Based Compensation Plans |
2013 Omnibus Equity Incentive Plan
The board of directors adopted the 2013 Omnibus Equity Incentive Plan (“2013 Plan”), which became effective upon the Company’s IPO. Grants are made from time to time by the Company’s board of directors at its discretion subject to certain restrictions as to the number and value of shares that may be granted to any individual. Upon adoption of the 2013 Plan, 5,500,000 shares of common stock were initially reserved for the issuance of awards. Pursuant to the automatic increase provided for in the 2013 Plan, the board of directors have approved share reserve increases aggregating 3,300,000, including 1,100,000 share reserve increase effective January 1, 2017. At December 31, 2016, there were 4,521,299 shares available for future grants under the Plan.
F-23
Marcus & Millichap, Inc.
Notes to Consolidated Financial Statements
Awards Granted and Settled
Under the 2013 Plan, the Company has issued RSA’s to non-employee directors and RSU’s to employees and independent contractors. All RSAs vest in equal annual installments over a three-year period from the date of grant. All RSUs vest in equal annual installments over a five-year period from the date of grant. Any unvested awards are canceled upon termination of service. Awards accelerate upon death subject to approval by the compensation committee. As of December 31, 2016, there were no issued or outstanding options, SARs, performance units or performance shares awards.
During the year ended December 31, 2016, 258,123 shares of RSAs and RSUs vested, including 5,158 shares not yet delivered, 435,026 shares of DSUs settled and 226,009 shares of common stock were withheld to pay applicable required employee statutory withholding taxes based on the market value of the shares on the vesting date. The shares withheld for taxes were returned to the share reserve and are available for future issuance in accordance with provisions of the 2013 Plan.
During the years ended December 31, 2016, 2015 and 2014, the Company recorded windfall tax benefits, net resulting from the settlement of stock-based award activity, in the amounts of $2.7 million, $6.2 million and $4.3 million, respectfully. Such windfall tax benefits were included as a component of additional paid-in capital when the awards were settled. As discussed in Note 1 – “Description of Business and Basis of Presentation,” in periods subsequent to December 31, 2016, any windfall tax benefits will be recorded as a discrete item in the Company’s provision for income taxes.
Outstanding Awards
Activity under the 2013 Plan consisted of the following (dollars in thousands, except per share data):
| RSA Grants to Non- employee Directors |
RSU Grants to Employees |
RSU Grants to Independent Contractors |
Total | Weighted- Average Grant Date Fair Value Per Share |
||||||||||||||||
| Nonvested shares at December 31, 2014 (1) |
42,882 | 516,437 | 647,690 | 1,207,009 | $ | 18.23 | ||||||||||||||
| Granted |
10,110 | 31,713 | 46,885 | 88,708 | 42.91 | |||||||||||||||
| Vested |
(17,628 | ) | (57,711 | ) | (138,119 | ) | (213,458 | ) | 14.90 | |||||||||||
| Transferred |
— | (8,423 | ) | 8,423 | — | 17.81 | ||||||||||||||
| Forfeited/canceled |
— | (13,047 | ) | (43,099 | ) | (56,146 | ) | 16.29 | ||||||||||||
|
|
|
|
|
|
|
|
|
|
|
|||||||||||
| Nonvested shares at December 31, 2015 (1) |
35,364 | 468,969 | 521,780 | 1,026,113 | $ | 21.17 | ||||||||||||||
|
|
|
|
|
|
|
|
|
|
|
|||||||||||
| Granted |
||||||||||||||||||||
| February 2016 |
— | 172,496 | 8,856 | 181,352 | ||||||||||||||||
| March 2016 |
— | 30,000 | — | 30,000 | ||||||||||||||||
| May 2016 |
14,742 | 11,051 | 8,188 | 33,981 | ||||||||||||||||
| August 2016 |
— | 12,781 | 49,608 | 62,389 | ||||||||||||||||
| November 2016 |
— | 12,684 | 15,228 | 27,912 | ||||||||||||||||
|
|
|
|
|
|
|
|
|
|
|
|||||||||||
| Total Granted |
14,742 | 239,012 | 81,880 | 335,634 | 23.76 | |||||||||||||||
| Vested |
(20,994 | ) | (104,820 | ) | (132,309 | ) | (258,123 | ) | 19.88 | |||||||||||
| Transferred |
— | 2,062 | (2,062 | ) | — | 14.54 | ||||||||||||||
| Forfeited/canceled |
— | (38,743 | ) | (14,451 | ) | (53,194 | ) | 20.07 | ||||||||||||
|
|
|
|
|
|
|
|
|
|
|
|||||||||||
| Nonvested shares at December 31, 2016 (1) |
29,112 | 566,480 | 454,838 | 1,050,430 | $ | 22.38 | ||||||||||||||
|
|
|
|
|
|
|
|
|
|
|
|||||||||||
| Unrecognized stock-based compensation expense as of December 31, 2016 (2) |
$ | 482 | $ | 10,299 | $ | 8,559 | $ | 19,340 | ||||||||||||
|
|
|
|
|
|
|
|
|
|||||||||||||
| Weighted average remaining vesting period (years) as of December 31, 2016 |
1.83 | 3.40 | 2.75 | 3.07 | ||||||||||||||||
|
|
|
|
|
|
|
|
|
|||||||||||||
F-24
Marcus & Millichap, Inc.
Notes to Consolidated Financial Statements
| (1) | Nonvested RSU’s will be settled through the issuance of new shares of common stock. |
| (2) | The total unrecognized compensation expense is expected to be recognized over a weighted-average period of approximately 3.07 years. |
For the years ended December 31, 2016 and 2015, the aggregate fair value of vested RSUs and RSAs were $7.0 million and $7.5 million, respectively.
As of December 31, 2016, 930,419 fully vested DSUs remained outstanding. For the years ended December 31, 2016 and 2015, the fair value of fully vested DSUs was $10.4 million and $18.6 million, respectively. See “Amendments to Restricted Stock and SARs” section below and Note 13 – “Earnings Per Share” for additional information.
Employee Stock Purchase Plan
In 2013, the Company adopted the 2013 Employee Stock Purchase Plan (“ESPP Plan”). The ESPP Plan qualifies under Section 423 of the IRS Code and provides for consecutive, non-overlapping 6-month offering periods. The offering periods generally start on the first trading day on or after May 15 and November 15 of each year. Qualifying employees may purchase shares of the Company stock at a 10% discount based on the lower of the market price at the beginning or end of the offering period, subject to IRS limitations. The Company determined that the ESPP Plan was a compensatory plan and is required to expense the fair value of the awards over each 6-month offering period.
The ESPP Plan initially had 366,667 shares of common stock reserved and 277,104 and 307,184 shares of common stock remain available for issuance at December 31, 2016 and 2015, respectively. The ESPP Plan provides for annual increases in the number of shares available for issuance under the ESPP, equal to the least of (i) 366,667 shares, (ii) 1% of the outstanding shares on such date, or (iii) an amount determined by the board. Pursuant to the provisions of the ESPP Plan, the board of directors determined a share reserve increase was not required in 2016. At December 31, 2016, total unrecognized compensation cost related to the ESPP Plan was $69,000 and is expected to be recognized over a weighted average period of 0.37 years.
Amendments to Restricted Stock and SARs
Restricted Stock
In connection with the IPO, the formula settlement value of all outstanding shares of REIS stock held by the plan participants was removed, all outstanding shares of REIS were converted to MMI shares and all such shares of stock are subject to sales restrictions that lapse at a rate of 20% per year for five years, if the participant remains as a service provider. In the event of death or termination of employment after reaching the age of 67, 100% of the shares of stock will be released from the resale restriction. Further, 100% of the shares of stock will be released from the resale restriction upon the consummation of a change of control of the Company. Of the original 3,689,326 shares subject to resale restriction, 1,475,730 shares remain subject to sales restriction for the year ended December 31, 2016.
SARs and DSUs
Prior to the IPO, certain employees were granted SARs. As of March 31, 2013, the outstanding SARs were frozen at the liability amount, and will be paid out to each participant in installments upon retirement or departure under the terms of the revised SARs agreements. To replace beneficial ownership in the SARs, the difference between the book value liability and the fair value of the awards was granted to plan participants in the form of DSUs. The DSUs were fully vested upon receipt and will be settled in actual stock at a rate of 20% per
F-25
Marcus & Millichap, Inc.
Notes to Consolidated Financial Statements
year if the participant remains employed by the Company during that period (otherwise all unsettled shares of stock upon termination from service will be settled five years from the termination date). In the event of death or termination of service after reaching the age of 67, 100% of the DSUs will be settled.
Summary of Stock-Based Compensation
Components of stock-based compensation included in selling, general and administrative expense in the consolidated statements of net and comprehensive income consisted of the following (in thousands, except common stock price):
| Year Ended December 31, | ||||||||||||
| 2016 | 2015 | 2014 | ||||||||||
| Employee stock purchase plan |
$ | 169 | $ | 285 | $ | 128 | ||||||
| RSAs – non-employee directors |
422 | 319 | 197 | |||||||||
| RSUs – employees |
3,130 | 2,351 | 817 | |||||||||
| RSUs – independent contractors (1) |
3,314 | 4,159 | 3,892 | |||||||||
|
|
|
|
|
|
|
|||||||
| $ | 7,035 | $ | 7,114 | $ | 5,034 | |||||||
|
|
|
|
|
|
|
|||||||
| Common stock price at beginning of period |
$ | 29.14 | $ | 33.25 | $ | 14.90 | ||||||
| Common stock price at end of period |
$ | 26.72 | $ | 29.14 | $ | 33.25 | ||||||
| (Decrease) increase in stock price |
$ | (2.42 | ) | $ | (4.11 | ) | $ | 18.35 | ||||
| (1) | The Company grants RSUs to independent contractors (i.e. investment sales and financing professionals), who are considered non-employees under ASC 718. Accordingly, such awards are required to be measured at fair value at the end of each reporting period until settlement under ASC 505. Stock-based compensation expense is therefore impacted by the changes in the Company’s common stock price during each reporting period. |
| 11. | Income Taxes |
The provision (loss) for income taxes consisted of the following (in thousands):
| Year Ended December 31, | ||||||||||||
| 2016 | 2015 | 2014 | ||||||||||
| Income (loss) before provision for income taxes: |
||||||||||||
| United States |
$ | 108,797 | $ | 116,448 | $ | 84,797 | ||||||
| Foreign |
(1,695 | ) | (3,080 | ) | (1,814 | ) | ||||||
|
|
|
|
|
|
|
|||||||
| $ | 107,102 | $ | 113,368 | $ | 82,983 | |||||||
|
|
|
|
|
|
|
|||||||
| The provision (benefit) for income taxes consisted of the following: |
||||||||||||
| Federal: |
||||||||||||
| Current |
$ | 36,228 | $ | 39,895 | $ | 28,452 | ||||||
| Deferred |
(337 | ) | (1,853 | ) | (566 | ) | ||||||
|
|
|
|
|
|
|
|||||||
| $ | 35,891 | $ | 38,042 | $ | 27,886 | |||||||
|
|
|
|
|
|
|
|||||||
| State: |
||||||||||||
| Current |
$ | 6,700 | $ | 7,058 | $ | 4,123 | ||||||
| Deferred |
(146 | ) | 1,918 | 1,443 | ||||||||
|
|
|
|
|
|
|
|||||||
| $ | 6,554 | $ | 8,976 | $ | 5,566 | |||||||
|
|
|
|
|
|
|
|||||||
| $ | 42,445 | $ | 47,018 | $ | 33,452 | |||||||
|
|
|
|
|
|
|
|||||||
F-26
Marcus & Millichap, Inc.
Notes to Consolidated Financial Statements
Significant components of the Company’s deferred tax assets, net consisted of the following (in thousands):
| December 31, | ||||||||
| 2016 | 2015 | |||||||
| Deferred Tax Assets: |
||||||||
| Accrued expenses and bonuses |
$ | 1,455 | $ | 1,787 | ||||
| Bad debt and other reserves |
2,191 | 2,178 | ||||||
| Deferred compensation |
19,511 | 15,405 | ||||||
| Stock-based compensation |
14,978 | 15,984 | ||||||
| Deferred rent |
1,731 | 1,735 | ||||||
| Net operating and capital loss carryforwards . |
1,637 | 1,281 | ||||||
| Other comprehensive income |
173 | 382 | ||||||
| State taxes |
497 | 496 | ||||||
|
|
|
|
|
|||||
| Deferred tax assets before valuation allowance |
42,173 | 39,248 | ||||||
| Valuation allowance |
(1,723 | ) | (1,311 | ) | ||||
|
|
|
|
|
|||||
| Deferred Tax Assets |
$ | 40,450 | $ | 37,937 | ||||
|
|
|
|
|
|||||
| Deferred Tax Liabilities: |
||||||||
| Fixed assets |
$ | (3,850 | ) | $ | (1,521 | ) | ||
| Prepaid expenses |
(1,029 | ) | (1,131 | ) | ||||
|
|
|
|
|
|||||
| Deferred Tax Liabilities |
(4,879 | ) | (2,652 | ) | ||||
|
|
|
|
|
|||||
| Deferred Tax Assets, Net |
$ | 35,571 | $ | 35,285 | ||||
|
|
|
|
|
|||||
As of December 31, 2016 and 2015, the Company had state and Canadian net operating and capital losses (“NOLs”) of approximately $6.4 million and $5.7 million, respectively, which will begin to expire in 2019. Certain limitations may be placed on NOLs as a result of “changes in control” as defined in Section 382 of the Internal Revenue Code. In the event a change in control occurs, it will have the effect of limiting the annual usage of the carryforwards in future years. Additional changes in control in future periods could result in further limitations of the Company’s ability to offset taxable income. In addition, the utilization of these NOLs may be subject to certain limitations under state and foreign laws.
A valuation allowance is required when it is more-likely-than not that all or a portion of a deferred tax asset will not be realized. Realization of deferred tax asset is dependent upon taxable income in prior carryback years, estimates of future taxable income, tax planning strategies and reversals of existing taxable temporary differences. Management determined that as of December 31, 2016 and 2015, $1.7 million and $1.3 million, respectively, of the deferred tax assets related to state and Canadian losses do not satisfy the recognition criteria and therefore have recorded a valuation allowance for this amount. The valuation allowance for deferred tax assets was increased by $412,000, $583,000 and $442,000 during 2016, 2015 and 2014, respectively. The increases are primarily related to the Company’s Canadian operations.
F-27
Marcus & Millichap, Inc.
Notes to Consolidated Financial Statements
The provision for income taxes differs from the amount computed by applying the statutory federal corporate income tax rate of 35% to income before provision for income taxes and consisted of the following (in thousands):
| Year Ended December 31, | ||||||||||||||||||||||||
| 2016 | 2015 | 2014 | ||||||||||||||||||||||
| Amount | Rate | Amount | Rate | Amount | Rate | |||||||||||||||||||
| Income tax expense at the federal statutory rate of 35% |
$ | 37,485 | 35.0 | % | $ | 39,679 | 35.0 | % | $ | 29,044 | 35.0 | % | ||||||||||||
| State income tax expense, net of federal benefit |
4,346 | 4.1 | % | 4,569 | 4.0 | % | 3,622 | 4.4 | % | |||||||||||||||
| Effect of state tax rate change on deferred taxes |
(79 | ) | (0.1 | )% | 1,273 | 1.1 | % | — | — | |||||||||||||||
| Permanent differences related to compensation charges, net of federal benefit |
39 | — | 81 | 0.1 | % | 163 | 0.2 | % | ||||||||||||||||
| Change in valuation allowance |
412 | 0.4 | % | 583 | 0.5 | % | 442 | 0.5 | % | |||||||||||||||
| Other |
242 | 0.2 | % | 833 | 0.8 | % | 181 | 0.2 | % | |||||||||||||||
|
|
|
|
|
|
|
|
|
|
|
|
|
|||||||||||||
| $ | 42,445 | 39.6 | % | $ | 47,018 | 41.5 | % | $ | 33,452 | 40.3 | % | |||||||||||||
|
|
|
|
|
|
|
|
|
|
|
|
|
|||||||||||||
During the year ended December 31, 2016 and 2015, the Company recorded $2.7 million and $6.2 million, respectively, as a credit to additional paid-in capital in the accompanying consolidated balance sheets, in connection with windfall tax benefits associated with the settlement of DSUs/RSUs/RSAs.
As of December 31, 2016 and 2015, the Company has no liabilities for unrecognized tax benefits or any related interest or penalties in the consolidated statements of net and comprehensive income.
The Company is subject to tax in various jurisdictions and, as a matter or ordinary course, the Company is subject to income tax examinations by the federal, state and foreign taxing authorities for the tax years 2012 to 2016. The Company is not currently under income tax examination by any taxing authorities.
The Company has not provided for U.S. taxes on unremitted earnings of its foreign subsidiary as it is operating at a loss and has no earnings and profits to remit. As a result, deferred taxes were not provided related to the cumulative translation adjustments.
| 12. | Retirement Plans |
Effective January 2014, the Company has its own defined contribution plan (the “Contribution Plan”) under Section 401(k) of the Internal Revenue Code for all eligible employees who have completed one month of service and have reached age 21. The Contribution Plan is subject to the provisions of the Employee Retirement Income Security Act of 1974, as amended. Participants may contribute up to 100% of their annual eligible compensation, subject to IRS limitation and ERISA. The Company makes matching contributions of 50% on the first 8% of employee contributions per pay period up to a maximum of the employee’s compensation, up to a maximum of $4,000 per eligible employee per year. Company matching contributions aggregated $628,000, $570,000 and $429,000 for the years ended December 31, 2016, 2015 and 2014, respectively, which is included in selling, general and administrative expense in the consolidated statements of net and comprehensive income.
F-28
Marcus & Millichap, Inc.
Notes to Consolidated Financial Statements
| 13. | Earnings per Share |
Basic and diluted earnings per share for the years ended December 31, 2016, 2015 and 2014 consisted of the following (in thousands, except per share data):
| Years Ended December 31, | ||||||||||||
| 2016 | 2015 | 2014 | ||||||||||
| Numerator (Basic and Diluted): |
||||||||||||
| Net income |
$ | 64,657 | $ | 66,350 | $ | 49,531 | ||||||
|
|
|
|
|
|
|
|||||||
| Denominator: |
||||||||||||
| Basic |
||||||||||||
| Weighted Average Common Shares Issued and Outstanding |
37,637 | 37,141 | 36,660 | |||||||||
| Deduct: Unvested RSAs (1) |
(36 | ) | (43 | ) | (43 | ) | ||||||
| Add: Fully vested DSUs (2) |
1,298 | 1,750 | 2,234 | |||||||||
|
|
|
|
|
|
|
|||||||
| Weighted Average Common Shares Outstanding |
38,899 | 38,848 | 38,851 | |||||||||
|
|
|
|
|
|
|
|||||||
| Basic earnings per common share |
$ | 1.66 | $ | 1.71 | $ | 1.27 | ||||||
|
|
|
|
|
|
|
|||||||
| Diluted |
||||||||||||
| Weighted Average Common Shares Outstanding from above |
38,899 | 38,848 | 38,851 | |||||||||
| Add: Dilutive effect of RSUs, RSAs & ESPP |
136 | 314 | 127 | |||||||||
|
|
|
|
|
|
|
|||||||
| Weighted Average Common Shares Outstanding |
39,035 | 39,162 | 38,978 | |||||||||
|
|
|
|
|
|
|
|||||||
| Diluted earnings per common share |
$ | 1.66 | $ | 1.69 | $ | 1.27 | ||||||
|
|
|
|
|
|
|
|||||||
| Antidilutive shares excluded from diluted earnings per common share (3) |
516 | 79 | 817 | |||||||||
|
|
|
|
|
|
|
|||||||
| (1) | RSAs were issued and outstanding to the non-employee directors and have a three year vesting term subject to service requirements. See Note 10 – “Stock-Based Compensation Plans” for additional information. |
| (2) | Shares are included in weighted average common shares outstanding as the shares are fully vested but have not yet been delivered. See Note 9 – “Stockholders’ Equity” for additional information. |
| (3) | Primarily pertaining to RSU grants to the Company’s employees and independent contractors. |
| 14. | Commitments and Contingencies |
Operating Leases
Future minimum lease payments under non-cancelable operating leases for office facilities and automobiles with terms in excess of one year consisted of the following (in thousands):
| December 31, 2016 | ||||
| 2017 |
$ | 16,328 | ||
| 2018 |
14,823 | |||
| 2019 |
12,173 | |||
| 2020 |
11,124 | |||
| 2021 |
8,701 | |||
| Thereafter |
13,186 | |||
|
|
|
|||
| $ | 76,335 | |||
|
|
|
|||
Deferred rent totaled $4.3 million as of December 31, 2016 and 2015, respectively. The noncurrent portion is included in defered rent and other liabilities and the current portion is included in accounts payable and
F-29
Marcus & Millichap, Inc.
Notes to Consolidated Financial Statements
accrued expenses in the accompanying consolidated balance sheets. Rental expense was $23.4 million, $17.8 million and $16.7 million for the years ended December 31, 2016, 2015 and 2014, respectively and is included in selling, general, and administrative expense in the accompanying consolidated statements of net and comprehensive income.
Certain facility leases provide for rental escalations related to increases in the lessors’ direct operating expenses.
The Company subleases certain office space to subtenants. The rental income received from these subleases is included as a reduction of rental expense and was not material for the years ended December 31, 2016, 2015 and 2014, respectively.
Credit Agreement
On June 18, 2014, the Company entered into a Credit Agreement with Wells Fargo Bank, National Association (“Bank”), dated as of June 1, 2014 (the “Credit Agreement”). The Credit Agreement provides for a $60.0 million principal amount senior secured revolving credit facility that is guaranteed by all of the Company’s domestic subsidiaries (the “Credit Facility”), which, as amended, matures on June 1, 2019. The Company may borrow, repay and reborrow amounts under the Credit Facility until its maturity date, at which time all amounts outstanding under the Credit Facility must be repaid in full.
Borrowings under the Credit Agreement are available for general corporate purposes and working capital. The Credit Facility includes a $10.0 million sublimit for the issuance of standby letters of credit of which $533,000 was utilized at December 31, 2016. Borrowings under the Credit Facility will bear interest, at the Company’s option, at either the (i) Base Rate (defined as the highest of (a) the Bank’s prime rate, (b) the Federal Funds Rate plus 1.5% and (c) one-month LIBOR plus 1.5%), or (ii) at a variable rate between 0.875% and 1.125% above LIBOR, based upon the total funded debt to EBITDA ratio. In connection with executing the Credit Agreement, as amended, the Company paid bank fees and other expenses, which are being amortized over the remaining term of the Credit Agreement. The Company pays a commitment fee of up to 0.1% per annum, payable quarterly, based on the amount of unutilized commitments under the Credit Facility. The amortization and commitment fee is included in interest expense in the accompanying consolidated statements of net and comprehensive income and was $116,000, $130,000 and $76,000 during the years ended December 31, 2016, 2015 and 2014, respectively. As of December 31, 2016, there were no amounts outstanding under the Credit Agreement.
The Credit Facility contains customary covenants, including financial and other covenant reporting requirements and events of default. Financial covenants require the Company, on a combined basis with its guarantors, to maintain (i) an EBITDAR Coverage Ratio (as defined in the Credit Agreement) of not less than 1.25:1.0 as of each quarter end and (ii) total funded debt to EBITDA not greater than 2.0:1.0 as of each quarter end both on a rolling 4-quarter basis. The Credit Facility is secured by substantially all assets of the Company, including pledges of 100% of the stock or other equity interest of each subsidiary except for the capital stock of a controlled foreign corporation (as defined in the Internal Revenue Code). As of December 31, 2016, the Company was in compliance with all financial and non-financial covenants.
Litigation
The Company is subject to various legal proceeding and claims that arise in the ordinary course of business, some of which involve claims for damages that are substantial in amount. Most of these litigation matters are covered by insurance, which contain deductibles, exclusions, claim limits and aggregate policy limits. While the
F-30
Marcus & Millichap, Inc.
Notes to Consolidated Financial Statements
ultimate liability for these legal proceeding cannot be determined, the Company reviews the need for its accrual for loss contingencies quarterly and records an accrual for litigation related losses where the likelihood of loss is both probable and estimable. The Company believes that the ultimate resolution of the legal proceedings will not have a material adverse effect on its financial condition or results of operations. The Company accrues legal fees for litigation as the legal services are provided.
Other
In connection with certain agreements with investment sales and financing professionals, the Company may agree to advance amounts to its investment sales and financing professionals upon reaching certain performance goals. Commitments as of December 31, 2016 aggregated $3.7 million. In January 2017, the Company committed and advanced $5.0 million.
| 15. | Selected Quarterly Financial Data (Unaudited) |
The Company’s real estate brokerage commissions and financing fees are seasonal, which can affect an investor’s ability to compare the Company’s financial condition and results of operation on a quarter-by-quarter basis. Historically, this seasonality has caused the Company’s revenue, operating income, net income and cash flows from operating activities to be lower in the first half of the year and higher in the second half of the year, particularly in the fourth quarter. These concentrations are due to an industry-wide focus of clients to complete transactions towards the end of the calendar year. In addition, the Company’s gross margins are typically lower during the second half of each year due to its commission structure for some of its senior investment sales and financing professionals. These senior investment sales and financing professionals are on a graduated commission schedule whose commission rates generally increase as they meet certain production thresholds.
| Three Months Ended | ||||||||||||||||||||||||||||||||
| Dec. 31 2016 |
Sep. 30 2016 |
Jun. 30 2016 |
Mar. 31 2016 |
Dec. 31 2015 |
Sep. 30 2015 |
Jun. 30 2015 |
Mar. 31 2015 |
|||||||||||||||||||||||||
| (in thousands, except per share data) | ||||||||||||||||||||||||||||||||
| Consolidated Financial Statement Data: |
||||||||||||||||||||||||||||||||
| Total revenues |
$ | 189,157 | $ | 180,634 | $ | 183,387 | $ | 164,272 | $ | 203,156 | $ | 165,876 | $ | 173,482 | $ | 146,541 | ||||||||||||||||
| Cost of services |
121,637 | 113,852 | 113,126 | 96,153 | 129,664 | 102,010 | 105,557 | 86,158 | ||||||||||||||||||||||||
| Operating income |
27,906 | 24,905 | 28,832 | 24,858 | 33,930 | 27,418 | 29,529 | 23,774 | ||||||||||||||||||||||||
| Net income |
17,174 | 15,144 | 17,524 | 14,815 | 19,949 | 15,176 | 17,556 | 13,669 | ||||||||||||||||||||||||
| Earnings per share: |
||||||||||||||||||||||||||||||||
| Basic |
$ | 0.44 | $ | 0.39 | $ | 0.45 | $ | 0.38 | $ | 0.51 | $ | 0.39 | $ | 0.45 | $ | 0.35 | ||||||||||||||||
| Diluted |
$ | 0.44 | $ | 0.39 | $ | 0.45 | $ | 0.38 | $ | 0.51 | $ | 0.39 | $ | 0.45 | $ | 0.35 | ||||||||||||||||
F-31
EXHIBIT INDEX
| Number |
Description | |
| 3.1 | Amended and Restated Certificate of Incorporation of Marcus & Millichap, Inc., (incorporated by reference to Exhibit 3.1 to the registrant’s quarterly report with respect to the quarter ended September 30, 2013 on Form 10-Q filed on November 22, 2013). | |
| 3.2 | Amended and Restated Bylaws of Marcus & Millichap, Inc., (incorporated by reference to Exhibit 3.2 to the registrant’s quarterly report with respect to the quarter ended September 30, 2013 on Form 10-Q filed on November 22, 2013). | |
| 4.1 | Specimen Stock Certificate (incorporated by reference to Exhibit 4.1 to the registrant’s registration statement on Form S-1 (No. 333-191316) filed on September 23, 2013). | |
| 10.1 | Form of Contribution Agreement by and among Marcus & Millichap, Inc., Marcus & Millichap Company, and certain other shareholders of Marcus & Millichap Real Estate Investment Services, Inc. (incorporated by reference to Exhibit 10.1 to the registrant’s registration statement on Form S-1 (No. 333-191316) filed on September 23, 2013). | |
| 10.2 | Form of Debt-for-Equity Exchange Agreement by and among Marcus & Millichap Company, George M. Marcus, William A. Millichap, The Donald and Beverly Lorenz Living Trust, and Lorenz Capital Assets, L.P., and with respect to certain sections therein, Marcus & Millichap, Inc. (incorporated by reference to Exhibit 10.2 to the registrant’s registration statement on Form S-1 (No. 333-191316) filed on September 23, 2013). | |
| 10.3 | Separation and Distribution Agreement by and between Marcus & Millichap, Inc. and Marcus & Millichap Company dated October 31, 2013. (incorporated by reference to Exhibit 10.1 to the registrant’s quarterly report on Form 10-Q for the quarter ended September 30, 2013 filed on November 22, 2013). | |
| 10.4 | Tax Matters Agreement by and between Marcus & Millichap, Inc. and Marcus & Millichap Company dated October 31, 2013 (incorporated by reference to Exhibit 10.2 to the registrant’s quarterly report on Form 10-Q for the quarter ended September 30, 2013 filed on November 22, 2013). | |
| 10.5 | Transition Services Agreement by and between Marcus & Millichap, Inc. and Marcus & Millichap Company dated October 31, 2013 (incorporated by reference to Exhibit 10.3 to the registrant’s quarterly report on Form 10-Q for the quarter ended September 30, 2013 filed on November 22, 2013). | |
| 10.6† | Form of Indemnification Agreement by and between Marcus & Millichap, Inc. and each of its Officers and Directors (incorporated by reference to Exhibit 10.7 to the registrant’s registration statement on Form S-1 (No. 333-191316) filed on September 23, 2013). | |
| 10.7† | 2013 Omnibus Equity Incentive Plan (incorporated by reference to Exhibit 10.8 to the registrant’s registration statement on Form S-1/A (No. 333-191316) filed on October 21, 2013). | |
| 10.8† | Form of Deferred Stock Unit Award Agreement under 2013 Omnibus Equity Incentive Plan (incorporated by reference to Exhibit 10.9 to the registrant’s registration statement on Form S-1 (No. 333-191316) filed on September 23, 2013). | |
| 10.9† | Form of Stock Option Award Agreement under 2013 Omnibus Equity Incentive Plan (incorporated by reference to Exhibit 10.10 to the registrant’s registration statement on Form S-1 (No. 333-191316) filed on September 23, 2013). | |
| 10.10† | Form of Restricted Stock Unit Award Agreement under 2013 Omnibus Equity Incentive Plan (incorporated by reference to Exhibit 10.11 to the registrant’s registration statement on Form S-1 (No. 333-191316) filed on September 23, 2013). | |
| Number |
Description | |
| 10.11† | Form of Restricted Stock Award Agreement under 2013 Omnibus Equity Incentive Plan (incorporated by reference to Exhibit 10.12 to the registrant’s registration statement on Form S-1/A (No. 333-191316) filed on October 21, 2013). | |
| 10.12† | Form of Amendment, Restatement and Freezing of Stock Appreciation Rights Agreement (incorporated by reference to Exhibit 10.13 to the registrant’s registration statement on Form S-1/A (No. 333-191316) filed on October 21, 2013). | |
| 10.13† | Form of Amendment, Restatement and Freezing of Stock Appreciation Rights Agreement (Section 409A grandfathered) (incorporated by reference to Exhibit 10.14 to the registrant’s registration statement on Form S-1 (No. 333-191316) filed on September 23, 2013). | |
| 10.14† | Form of Sale Restriction Agreement (incorporated by reference to Exhibit 10.15 to the registrant’s registration statement on Form S-1 (No. 333-191316) filed on September 23, 2013). | |
| 10.15† | 2013 Employee Stock Purchase Plan (incorporated by reference to Exhibit 10.16 to the registrant’s registration statement on Form S-1/A (No. 333-191316) filed on October 28, 2013). | |
| 10.16† | Amendment to Exhibit A to Employment Agreement dated July 1, 2010, by and between John J. Kerin and Marcus & Millichap, Inc. dated as of March 19, 2014 (incorporated by reference to Exhibit 10.17 to the registrant’s Annual Report on Form 10-K for the year ended December 31, 2013 filed on March 21, 2014). | |
| 10.17† | Executive Short-Term Incentive Plan, dated March 13, 2014 (incorporated by reference to Exhibit 99.1 to the registrant’s Current Report on Form 8-K filed on March 17, 2014). | |
| 10.18 | Credit Agreement, by and between Marcus & Millichap, Inc. and Wells Fargo Bank, National Association dated as of June 1, 2014 (incorporated by reference to Exhibit 10.1 to the registrant’s Current Report on Form 8-K filed on June 24, 2014). | |
| 10.19 | First Amendment to Credit Agreement, between the Company and Wells Fargo Bank, National Association dated as of August 21, 2015 (incorporated by reference to Exhibit 10.1 to the registrant’s Quarterly Report on Form 10-Q for the quarter ended September 30, 2015 filed on November 9, 2015). | |
| 10.20† | Employment Agreement between the Company and Hessam Nadji effective as of March 31, 2016 (incorporated by reference to Exhibit 10.21 to the registrant’s Current Report on Form 8-K/A (No. 001-36155) filed on April 8, 2016). | |
| 10.21† | Retirement Agreement and Release of All Claims between the Company and John J. Kerin dated as of June 13, 2016 (incorporated by reference to Exhibit 10.22 to the registrant’s Quarterly Report on Form 10-Q for the quarter ended June 30, 2016 filed on August 8, 2016). | |
| 10.22 | Second Amendment to Credit Agreement and Amended and Restated Revolving Line of Credit Note, between the Company and Wells Fargo Bank, National Association dated as of August 10, 2016 (incorporated by reference to Exhibit 10.23 to the registrant’s Quarterly Report on Form 10-Q for the quarter ended September 30, 2016 filed on November 7, 2016). | |
| 10.23†* | Employment Agreement between the Company and Mitchell R. LaBar effective as of March 31, 2016. | |
| 21.1* | List of Subsidiaries. | |
| 23.1* | Consent of Ernst & Young LLP. | |
| 31.1* | Certification of Chief Executive Officer pursuant to Rule 13a-14(a) under the Exchange Act, as adopted pursuant to Section 302 of the Sarbanes-Oxley Act of 2002 | |
| 31.2* | Certification of Chief Financial Officer pursuant to Rule 13a-14(a) under the Exchange Act, as adopted pursuant to Section 302 of the Sarbanes-Oxley Act of 2002 | |
| Number |
Description | |
| 32.1** | Certification of Chief Executive Officer and Chief Financial Officer pursuant to Section 906 of the Sarbanes-Oxley Act of 2002. | |
| 101.SCH* | XBRL Taxonomy Extension Schema Document | |
| 101.CAL* | XBRL Taxonomy Calculation Linkbase Document | |
| 101.DEF* | XBRL Taxonomy Extension Definition Document | |
| 101.LAB* | XBRL Taxonomy Label Linkbase Document | |
| 101.PRE* | XBRL Taxonomy Presentation Linkbase Document | |
| † | Indicates management contract or compensatory plan. |
| * | Filed herewith. |
| ** | Furnished, not filed. |