

INVESTOR PRESENTATION September 2020 Exhibit 99.1
Certain statements in this presentation are “forward-looking statements” within the meaning of the federal securities laws, including our business outlook for 2020 and beyond and expectations for market share growth. Statements about our beliefs and expectations and statements containing the words “may,” “could,” “would,” “should,” “believe,” “expect,” “anticipate,” “plan,” “estimate,” “target,” “project,” “intend,” “well-positioned” and similar expressions constitute forward-looking statements. These forward-looking statements involve known and unknown risks, uncertainties and other factors that may cause the Company’s actual results and performance in future periods to be materially different from any future results or performance suggested in forward-looking statements in this earnings press release. Investors are urged to consider these factors carefully in evaluating the forward-looking statements and are cautioned not to place undue reliance on such forward-looking statements. Any forward-looking statements speak only as of the date of this earnings press release and, except to the extent required by applicable securities laws, the Company expressly disclaims any obligation to update or revise any of them to reflect actual results, any changes in expectations or any change in events. If the Company does update one or more forward-looking statements, no inference should be drawn that it will make additional updates with respect to those or other forward-looking statements. Factors that could cause results to differ materially include, but are not limited to: (1) general economic conditions and commercial real estate market conditions, including the conditions in the global markets and, in particular, the U.S. debt markets; (2) the Company’s ability to attract and retain transaction professionals; (3) the Company’s ability to retain its business philosophy and partnership culture; (4) competitive pressures; (5) the Company’s ability to integrate new agents and sustain its growth; and (6) other factors discussed in the Company’s public filings, including the risk factors included in the Company’s Annual Report on Form 10-K filed with the Securities and Exchange Commission on March 02, 2020. FORWARD-LOOKING STATEMENTS
COMPANY OVERVIEW NATIONAL PLATFORM FOCUSED ON REAL ESTATE INVESTMENT BROKERAGE 49-year old platform dedicated to perfecting real estate investment brokerage Designed to maximize real estate value, facilitate investment options by geography and property type and create liquidity for investors MARKET LEADER IN THE PRIVATE CLIENT MARKET SEGMENT Only national brokerage firm predominantly focused on servicing the Private Client Market segment which consistently accounts for 80%+ of CRE transactions in the U.S. Private client business has been supplemented with penetration in larger transactions and institutional clients over the past 10 years PLATFORM COMBINES BROKERAGE EXPERTISE AND VALUE-ADDED SERVICES Marcus & Millichap Capital Corporation (“MMCC”), Research & Advisory support client dialogue, financing, strategy and sales execution Culture and policy of information sharing is key to maximizing investor value MANAGEMENT WITH SIGNIFICANT INVESTMENT BROKERAGE EXPERIENCE Non-competitive management with extensive investment brokerage experience, committed to training, coaching and supporting investment sales professionals Culture creates a competitive advantage through agent retention and better client results WELL-POSITIONED TO EXECUTE ON STRATEGIC GROWTH PLAN Positioned to increase Private Client Market segment share, expand presence in specialty niches/larger transaction business and grow financing division, MMCC Strong balance sheet with no debt provides financial flexibility to pursue strategic acquisitions
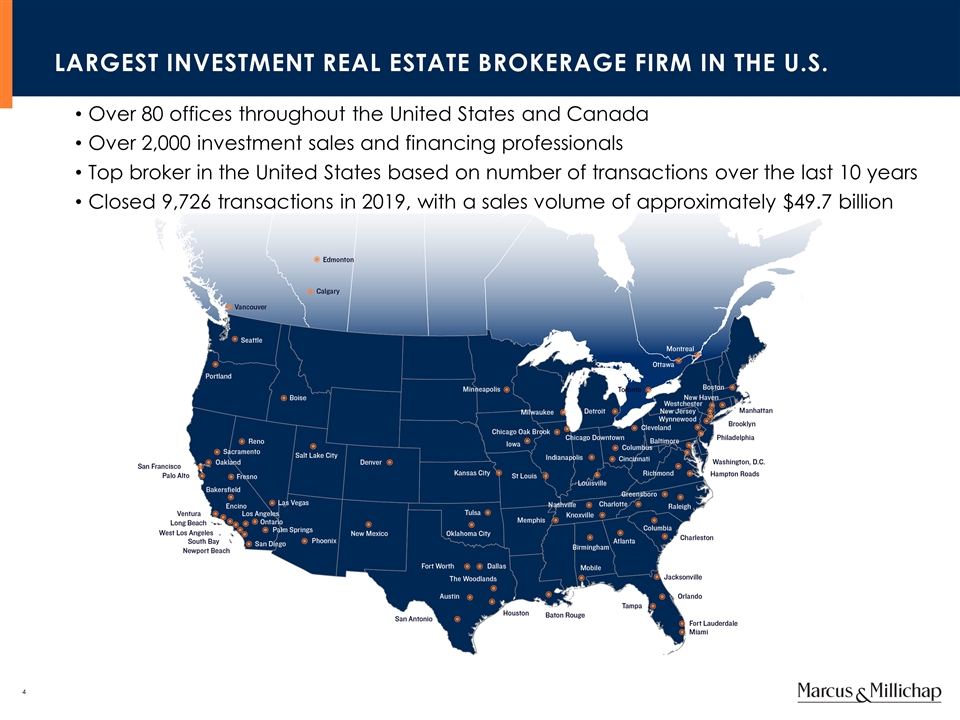
LARGEST INVESTMENT REAL ESTATE BROKERAGE FIRM IN THE U.S. Over 80 offices throughout the United States and Canada Over 2,000 investment sales and financing professionals Top broker in the United States based on number of transactions over the last 10 years Closed 9,726 transactions in 2019, with a sales volume of approximately $49.7 billion
BUSINESS MODEL DIFFERENTIATION: BRINGING WALL STREET TO MAIN STREET MAXIMIZING SELLERS’ VALUE Critical mass of investment specialists and national platform (large local and national sales force) Information sharing culture and systems necessary to increase property exposure Marketing process that attracts interested and qualified buyers Real-time market information to support valuation and decision-making FULFILLING BUYERS’ NEEDS Real-time awareness of diverse and deliverable investment opportunities Local expertise on a national scale Market information to support acquisition strategies SUPPORTING AGENTS’ NEEDS Specialized training, coaching and mentoring Collaborative network supported by experienced management Best practices, proprietary technology, networking, business development and referrals
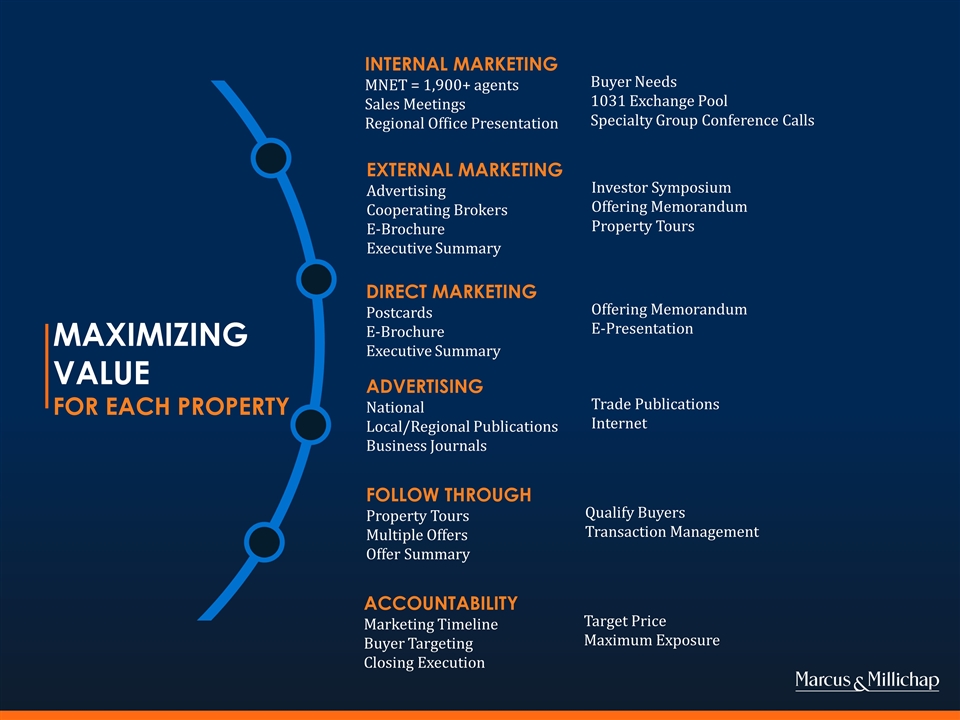
MAXIMIZING VALUE FOR EACH PROPERTY DIRECT MARKETING Postcards E-Brochure Executive Summary Offering Memorandum E-Presentation EXTERNAL MARKETING Advertising Cooperating Brokers E-Brochure Executive Summary Investor Symposium Offering Memorandum Property Tours INTERNAL MARKETING MNET = 1,900+ agents Sales Meetings Regional Office Presentation Buyer Needs 1031 Exchange Pool Specialty Group Conference Calls ADVERTISING National Local/Regional Publications Business Journals Trade Publications Internet FOLLOW THROUGH Property Tours Multiple Offers Offer Summary Qualify Buyers Transaction Management ACCOUNTABILITY Marketing Timeline Buyer Targeting Closing Execution Target Price Maximum Exposure
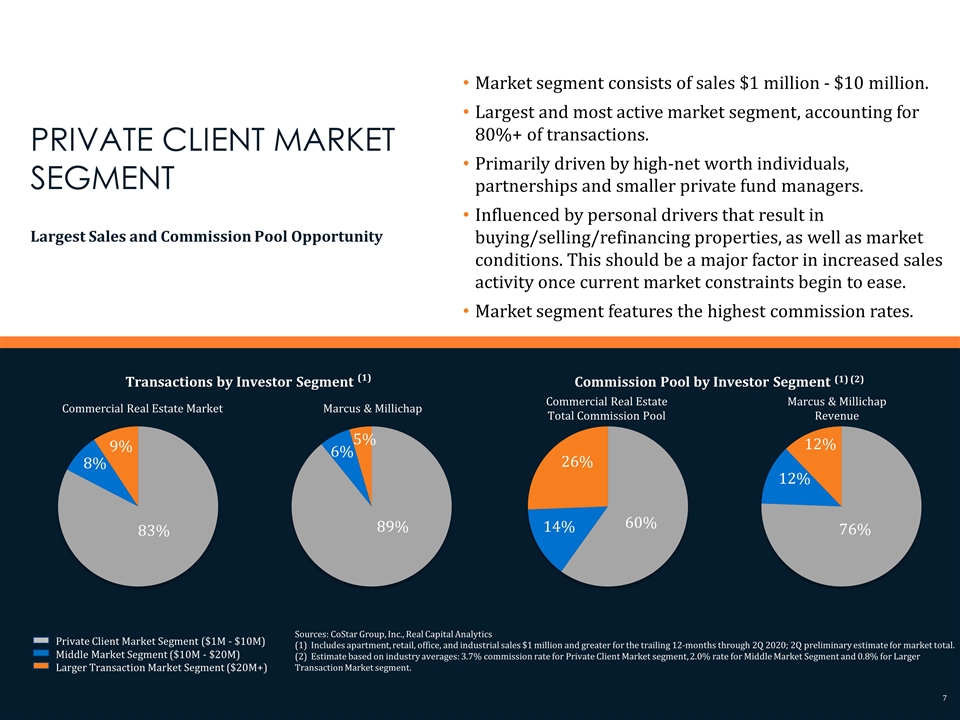
Market segment consists of sales $1 million - $10 million. Largest and most active market segment, accounting for 80%+ of transactions. Primarily driven by high-net worth individuals, partnerships and smaller private fund managers. Influenced by personal drivers that result in buying/selling/refinancing properties, as well as market conditions. This should be a major factor in increased sales activity once current market constraints begin to ease. Market segment features the highest commission rates. Sources: CoStar Group, Inc., Real Capital Analytics (1) Includes apartment, retail, office, and industrial sales $1 million and greater for the trailing 12-months through 2Q 2020; 2Q preliminary estimate for market total. (2) Estimate based on industry averages: 3.7% commission rate for Private Client Market segment, 2.0% rate for Middle Market Segment and 0.8% for Larger Transaction Market segment. PRIVATE CLIENT MARKET SEGMENT Largest Sales and Commission Pool Opportunity Transactions by Investor Segment (1) Commercial Real Estate Market Marcus & Millichap Commission Pool by Investor Segment (1) (2) Commercial Real Estate Total Commission Pool Marcus & Millichap Revenue Private Client Market Segment ($1M - $10M) Middle Market Segment ($10M - $20M) Larger Transaction Market Segment ($20M+) 83% 8% 9% 89% 6% 5% 60% 14% 26% 76% 12% 12%
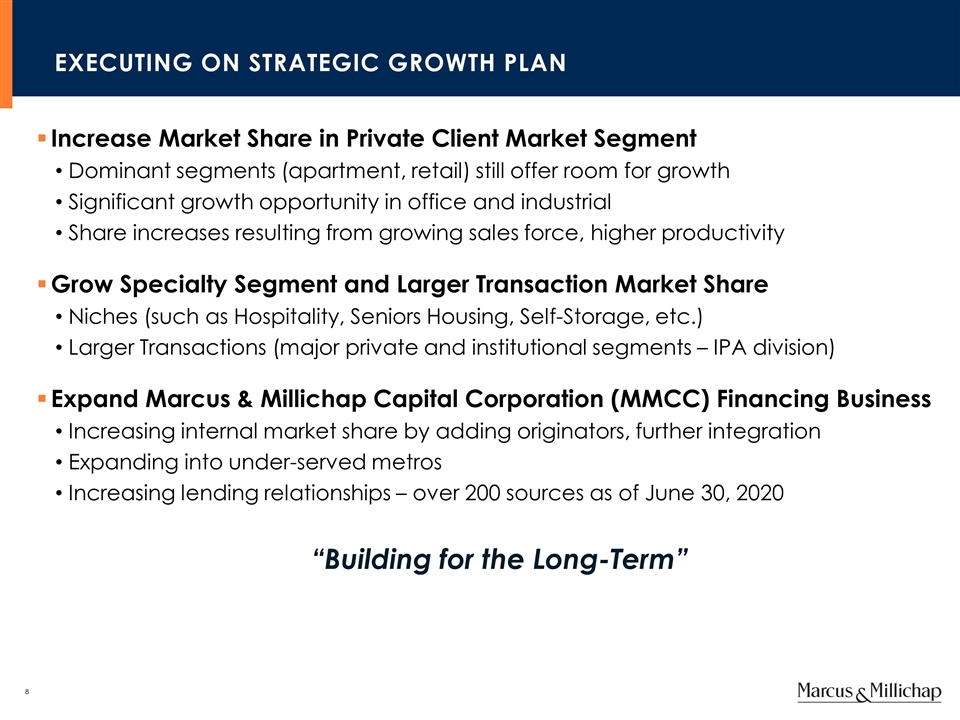
EXECUTING ON STRATEGIC GROWTH PLAN Increase Market Share in Private Client Market Segment Dominant segments (apartment, retail) still offer room for growth Significant growth opportunity in office and industrial Share increases resulting from growing sales force, higher productivity Grow Specialty Segment and Larger Transaction Market Share Niches (such as Hospitality, Seniors Housing, Self-Storage, etc.) Larger Transactions (major private and institutional segments – IPA division) Expand Marcus & Millichap Capital Corporation (MMCC) Financing Business Increasing internal market share by adding originators, further integration Expanding into under-served metros Increasing lending relationships – over 200 sources as of June 30, 2020 “Building for the Long-Term”
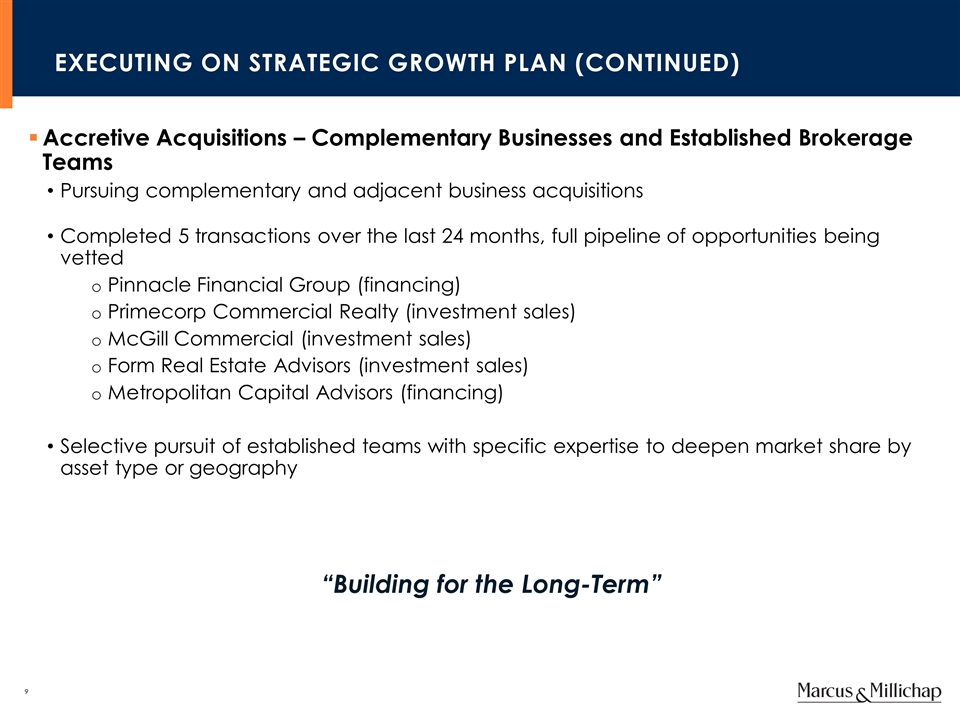
EXECUTING ON STRATEGIC GROWTH PLAN (Continued) Accretive Acquisitions – Complementary Businesses and Established Brokerage Teams Pursuing complementary and adjacent business acquisitions Completed 5 transactions over the last 24 months, full pipeline of opportunities being vetted Pinnacle Financial Group (financing) Primecorp Commercial Realty (investment sales) McGill Commercial (investment sales) Form Real Estate Advisors (investment sales) Metropolitan Capital Advisors (financing) Selective pursuit of established teams with specific expertise to deepen market share by asset type or geography “Building for the Long-Term”

Business Continuity and Recent Business Trends
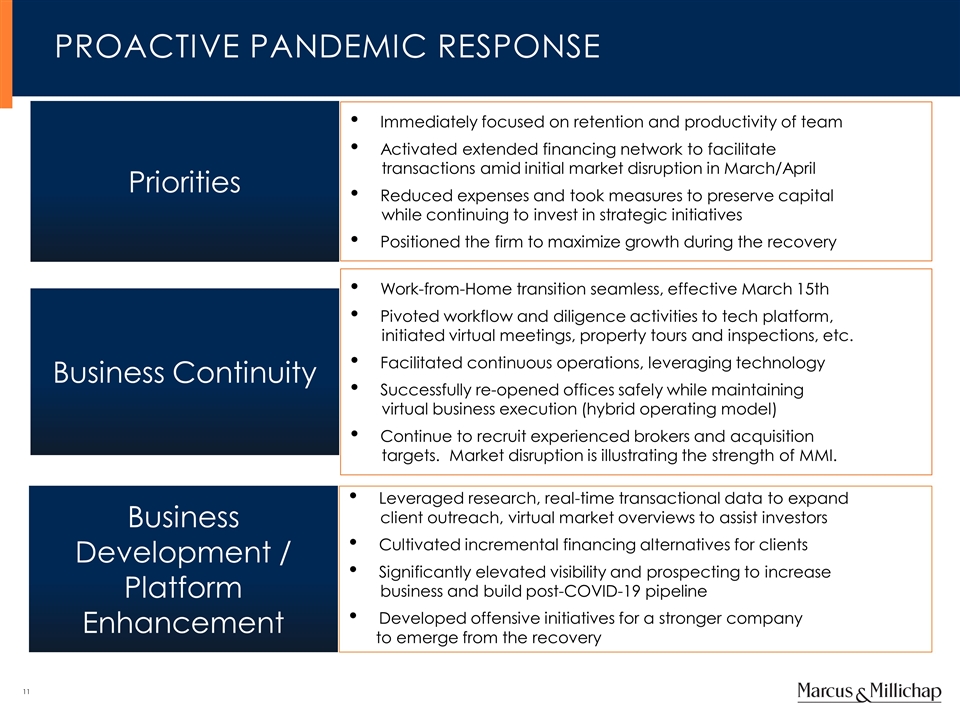
Proactive pandemic response Priorities Business Continuity Business Development / Platform Enhancement Immediately focused on retention and productivity of team Activated extended financing network to facilitate transactions amid initial market disruption in March/April Reduced expenses and took measures to preserve capital while continuing to invest in strategic initiatives Positioned the firm to maximize growth during the recovery Work-from-Home transition seamless, effective March 15th Pivoted workflow and diligence activities to tech platform, initiated virtual meetings, property tours and inspections, etc. Facilitated continuous operations, leveraging technology Successfully re-opened offices safely while maintaining virtual business execution (hybrid operating model) Continue to recruit experienced brokers and acquisition targets. Market disruption is illustrating the strength of MMI. Leveraged research, real-time transactional data to expand client outreach, virtual market overviews to assist investors Cultivated incremental financing alternatives for clients Significantly elevated visibility and prospecting to increase business and build post-COVID-19 pipeline Developed offensive initiatives for a stronger company to emerge from the recovery

Leading through the global health crisis Strategy and Actions Executed Since March 15, 2020
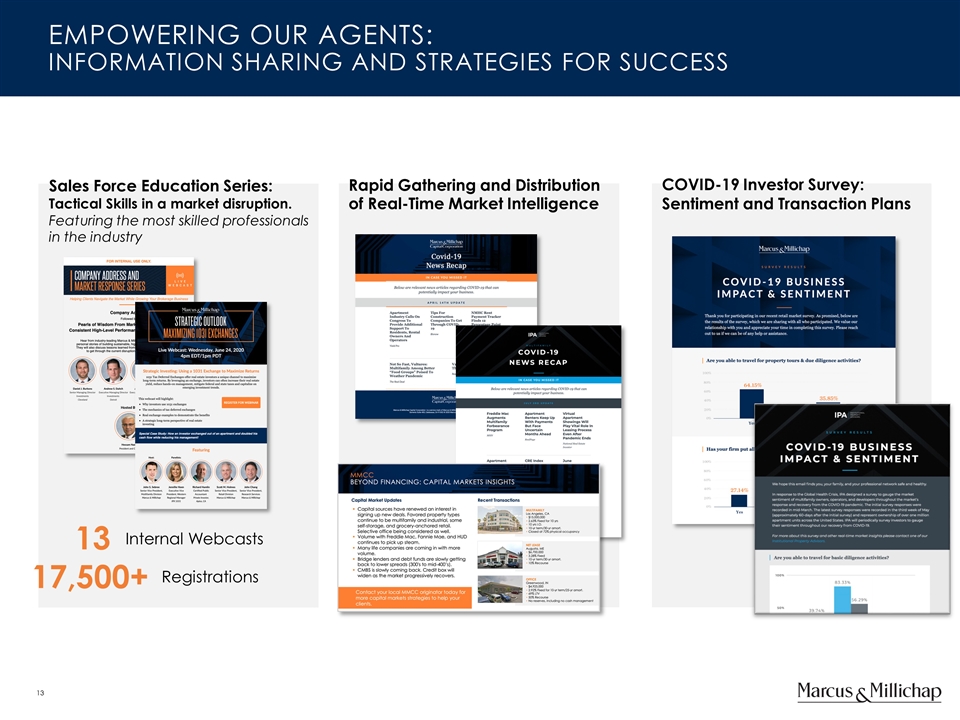
Empowering our agents: information sharing and strategies for success Sales Force Education Series: Tactical Skills in a market disruption. Featuring the most skilled professionals in the industry Rapid Gathering and Distribution of Real-Time Market Intelligence COVID-19 Investor Survey: Sentiment and Transaction Plans 17,500+ Registrations 13 Internal Webcasts Empowering our agents: information sharing and strategies for success
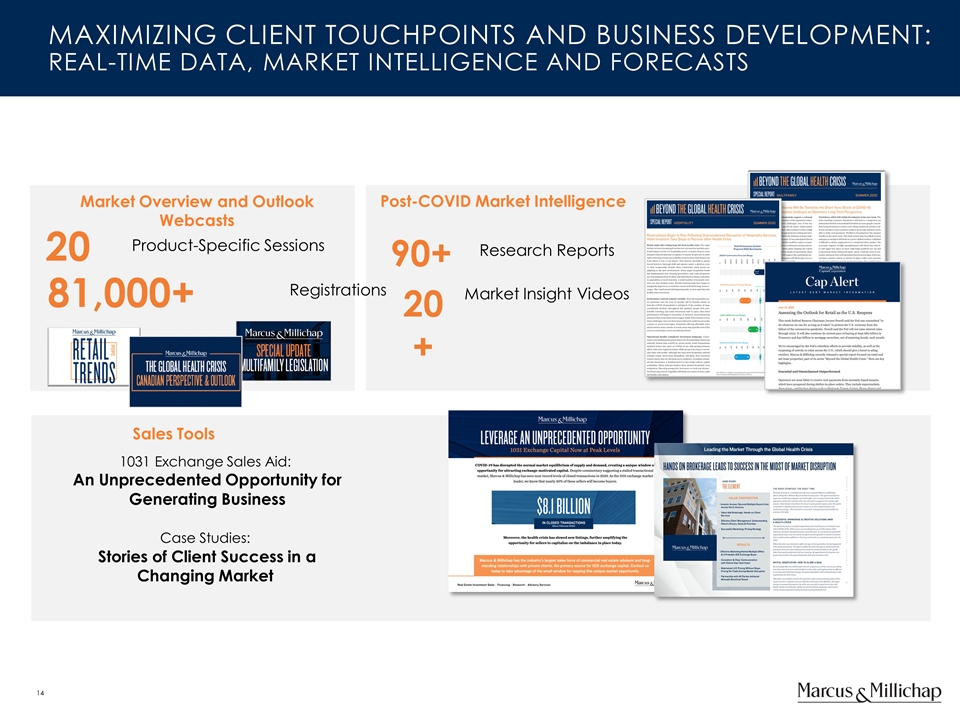
Maximizing client touchpoints and business development: real-time data, market intelligence and forecasts 1031 Exchange Sales Aid: An Unprecedented Opportunity for Generating Business Case Studies: Stories of Client Success in a Changing Market Market Overview and Outlook Webcasts Post-COVID Market Intelligence Sales Tools 20 Product-Specific Sessions 81,000+ Registrations 90+ Research Reports 20+ Market Insight Videos Maximizing client touchpoints and business development: real-time data, market intelligence and forecasts

Growing through the market disruption: Attracting TOP TALENT With the industry's leading brokerage platform 18 Experienced Agents Since March 15, we increased the tools and campaigns to engage both new and experienced agents: 200+ Gross New Agents Joining the Firm 12 Years, Average Experience Virtual Career Nights to Engage Walk-On Talent Email Campaign Targeting Experienced Agents Growing through the market disruption: Attracting TOP TALENT With the industry's leading brokerage platform
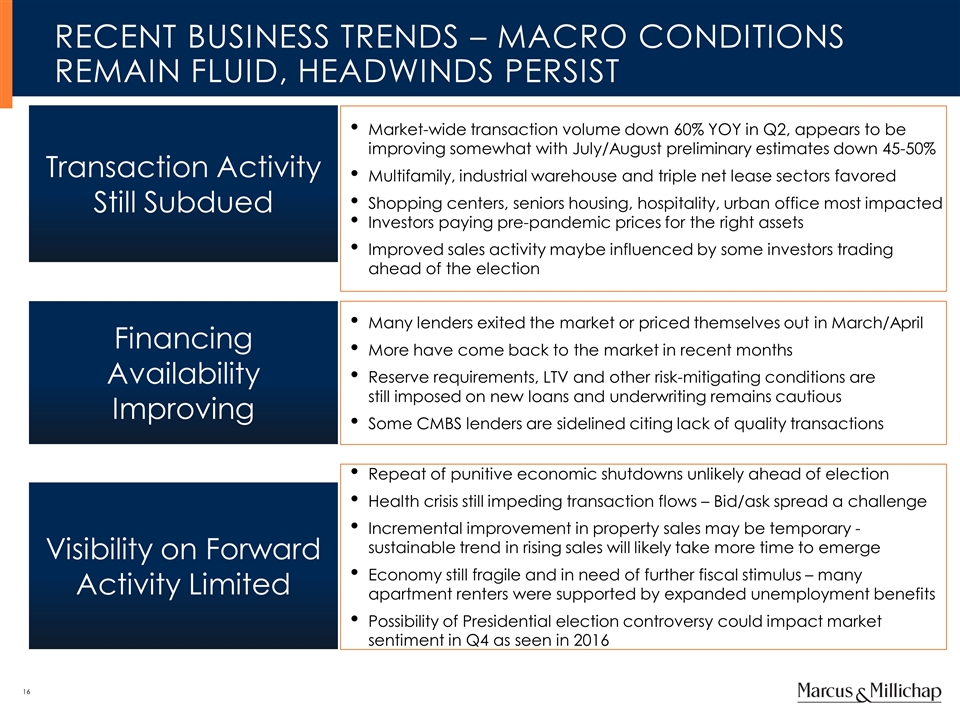
Recent Business Trends – Macro conditions remain Fluid, Headwinds persist Transaction Activity Still Subdued Financing Availability Improving Visibility on Forward Activity Limited Market-wide transaction volume down 60% YOY in Q2, appears to be improving somewhat with July/August preliminary estimates down 45-50% Multifamily, industrial warehouse and triple net lease sectors favored Shopping centers, seniors housing, hospitality, urban office most impacted Investors paying pre-pandemic prices for the right assets Improved sales activity maybe influenced by some investors trading ahead of the election Many lenders exited the market or priced themselves out in March/April More have come back to the market in recent months Reserve requirements, LTV and other risk-mitigating conditions are still imposed on new loans and underwriting remains cautious Some CMBS lenders are sidelined citing lack of quality transactions Repeat of punitive economic shutdowns unlikely ahead of election Health crisis still impeding transaction flows – Bid/ask spread a challenge Incremental improvement in property sales may be temporary - sustainable trend in rising sales will likely take more time to emerge Economy still fragile and in need of further fiscal stimulus – many apartment renters were supported by expanded unemployment benefits Possibility of Presidential election controversy could impact market sentiment in Q4 as seen in 2016
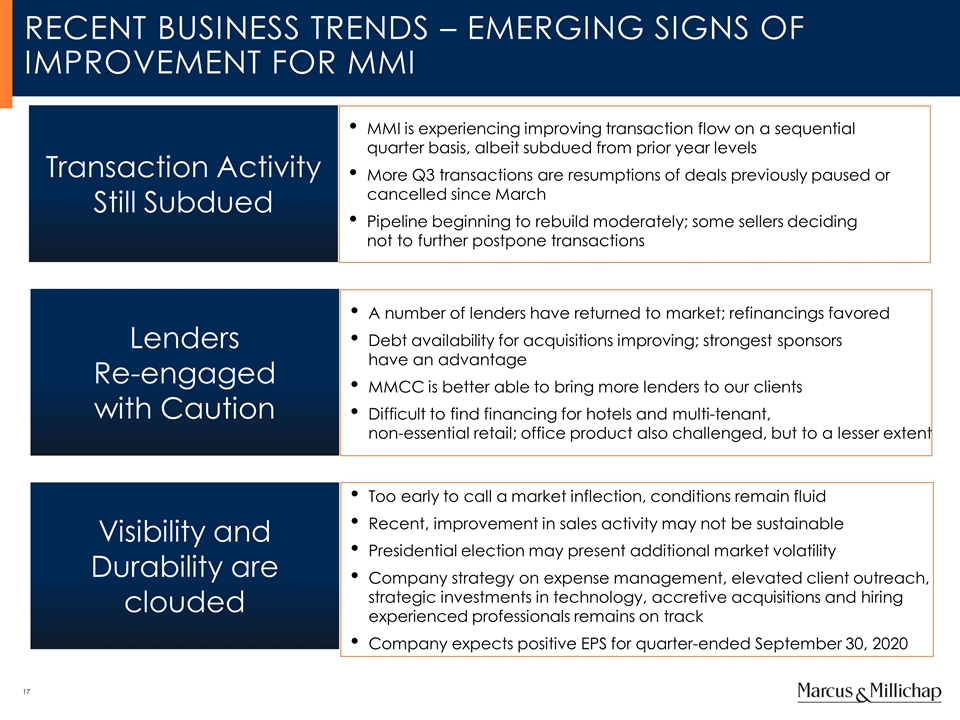
Recent Business Trends – Emerging Signs of Improvement for MMI Transaction Activity Still Subdued Lenders Re-engaged with Caution Visibility and Durability are clouded MMI is experiencing improving transaction flow on a sequential quarter basis, albeit subdued from prior year levels More Q3 transactions are resumptions of deals previously paused or cancelled since March Pipeline beginning to rebuild moderately; some sellers deciding not to further postpone transactions A number of lenders have returned to market; refinancings favored Debt availability for acquisitions improving; strongest sponsors have an advantage MMCC is better able to bring more lenders to our clients Difficult to find financing for hotels and multi-tenant, non-essential retail; office product also challenged, but to a lesser extent Too early to call a market inflection, conditions remain fluid Recent, improvement in sales activity may not be sustainable Presidential election may present additional market volatility Company strategy on expense management, elevated client outreach, strategic investments in technology, accretive acquisitions and hiring experienced professionals remains on track Company expects positive EPS for quarter-ended September 30, 2020

MARKET OVERVIEW
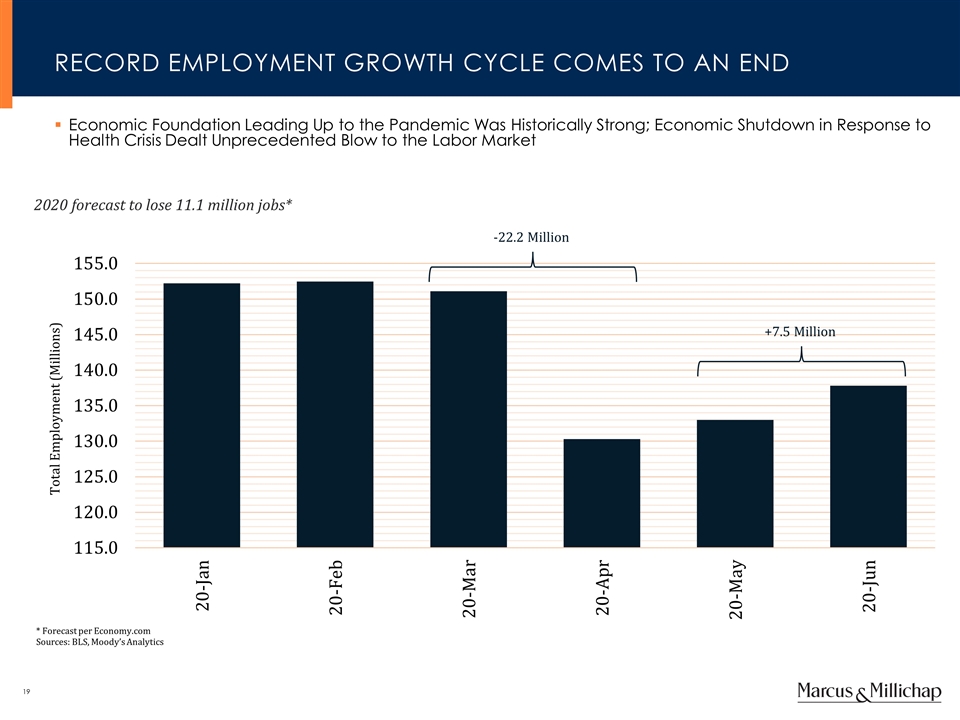
Total Employment (Millions) * Forecast per Economy.com Sources: BLS, Moody’s Analytics -22.2 Million RECORD EMPLOYMENT GROWTH CYCLE COMES TO AN END Economic Foundation Leading Up to the Pandemic Was Historically Strong; Economic Shutdown in Response to Health Crisis Dealt Unprecedented Blow to the Labor Market 2020 forecast to lose 11.1 million jobs* +7.5 Million
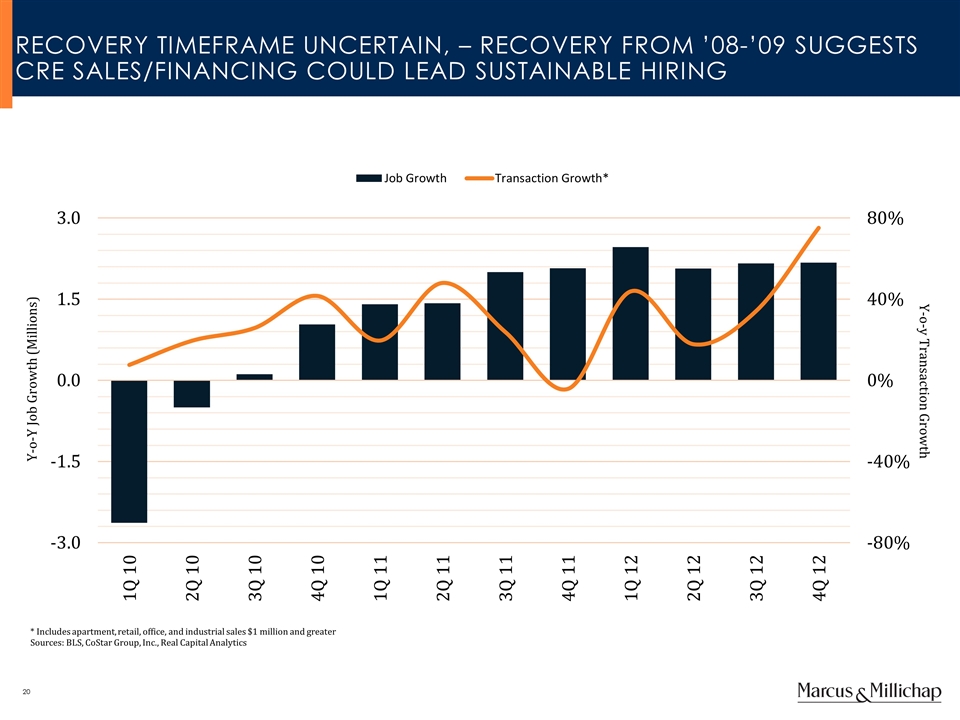
Y-o-Y Job Growth (Millions) RECOVERY TIMEFRAME UNCERTAIN, – Recovery FROM ’08-’09 SUGGESTS CRE SALES/FINANCING COULD LEAD SUSTAINABLE HIRING Y-o-y Transaction Growth * Includes apartment, retail, office, and industrial sales $1 million and greater Sources: BLS, CoStar Group, Inc., Real Capital Analytics
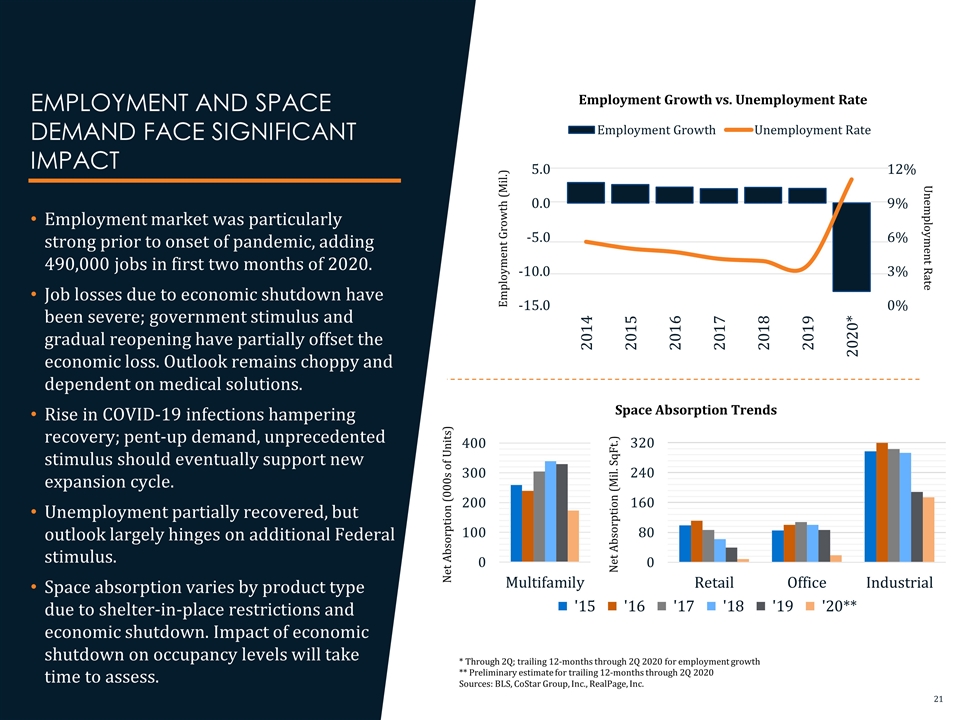
Employment Growth (Mil.) Unemployment Rate Employment Growth vs. Unemployment Rate Net Absorption (000s of Units) Net Absorption (Mil. SqFt.) * Through 2Q; trailing 12-months through 2Q 2020 for employment growth ** Preliminary estimate for trailing 12-months through 2Q 2020 Sources: BLS, CoStar Group, Inc., RealPage, Inc. Space Absorption Trends EMPLOYMENT AND SPACE DEMAND FACE SIGNIFICANT IMPACT Employment market was particularly strong prior to onset of pandemic, adding 490,000 jobs in first two months of 2020. Job losses due to economic shutdown have been severe; government stimulus and gradual reopening have partially offset the economic loss. Outlook remains choppy and dependent on medical solutions. Rise in COVID-19 infections hampering recovery; pent-up demand, unprecedented stimulus should eventually support new expansion cycle. Unemployment partially recovered, but outlook largely hinges on additional Federal stimulus. Space absorption varies by product type due to shelter-in-place restrictions and economic shutdown. Impact of economic shutdown on occupancy levels will take time to assess.
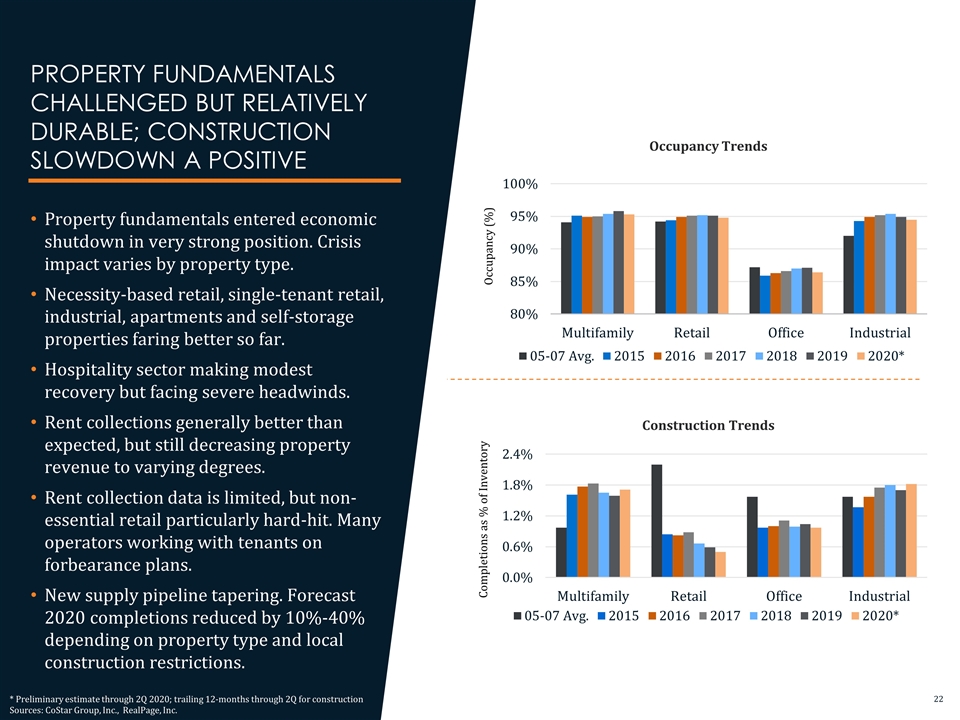
Occupancy Trends Occupancy (%) Construction Trends Completions as % of Inventory PROPERTY FUNDAMENTALS CHALLENGED BUT RELATIVELY DURABLE; CONSTRUCTION SLOWDOWN A POSITIVE Property fundamentals entered economic shutdown in very strong position. Crisis impact varies by property type. Necessity-based retail, single-tenant retail, industrial, apartments and self-storage properties faring better so far. Hospitality sector making modest recovery but facing severe headwinds. Rent collections generally better than expected, but still decreasing property revenue to varying degrees. Rent collection data is limited, but non-essential retail particularly hard-hit. Many operators working with tenants on forbearance plans. New supply pipeline tapering. Forecast 2020 completions reduced by 10%-40% depending on property type and local construction restrictions. * Preliminary estimate through 2Q 2020; trailing 12-months through 2Q for construction Sources: CoStar Group, Inc., RealPage, Inc.
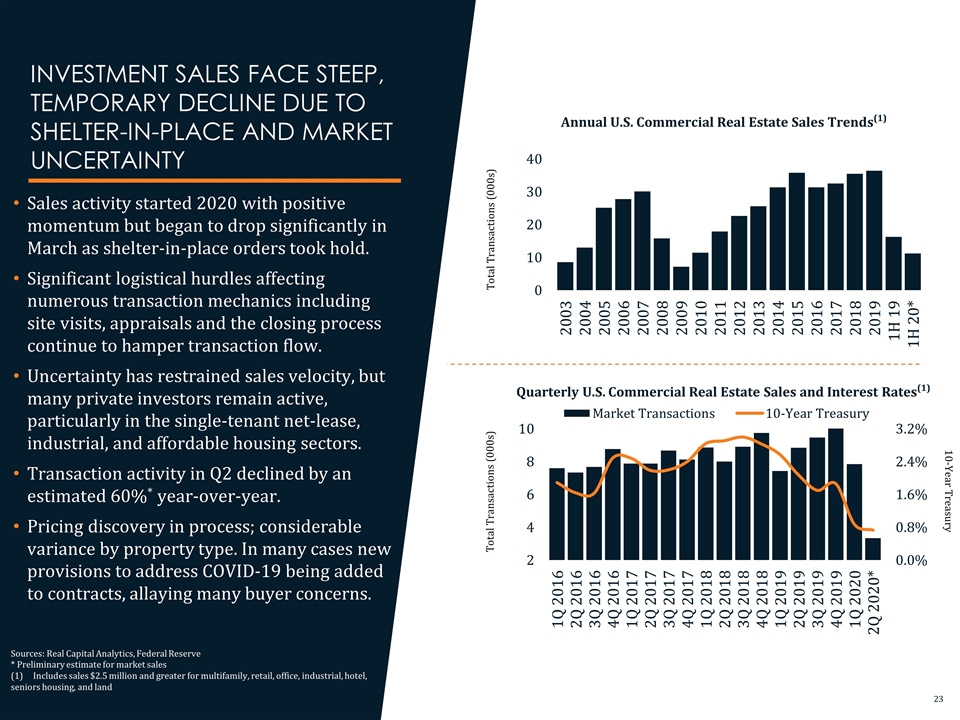
Quarterly U.S. Commercial Real Estate Sales and Interest Rates(1) INVESTMENT SALES FACE STEEP, TEMPORARY DECLINE DUE TO SHELTER-IN-PLACE AND MARKET UNCERTAINTY Sales activity started 2020 with positive momentum but began to drop significantly in March as shelter-in-place orders took hold. Significant logistical hurdles affecting numerous transaction mechanics including site visits, appraisals and the closing process continue to hamper transaction flow. Uncertainty has restrained sales velocity, but many private investors remain active, particularly in the single-tenant net-lease, industrial, and affordable housing sectors. Transaction activity in Q2 declined by an estimated 60%* year-over-year. Pricing discovery in process; considerable variance by property type. In many cases new provisions to address COVID-19 being added to contracts, allaying many buyer concerns. Annual U.S. Commercial Real Estate Sales Trends(1) Total Transactions (000s) Sources: Real Capital Analytics, Federal Reserve * Preliminary estimate for market sales (1) Includes sales $2.5 million and greater for multifamily, retail, office, industrial, hotel, seniors housing, and land Total Transactions (000s) 10-Year Treasury
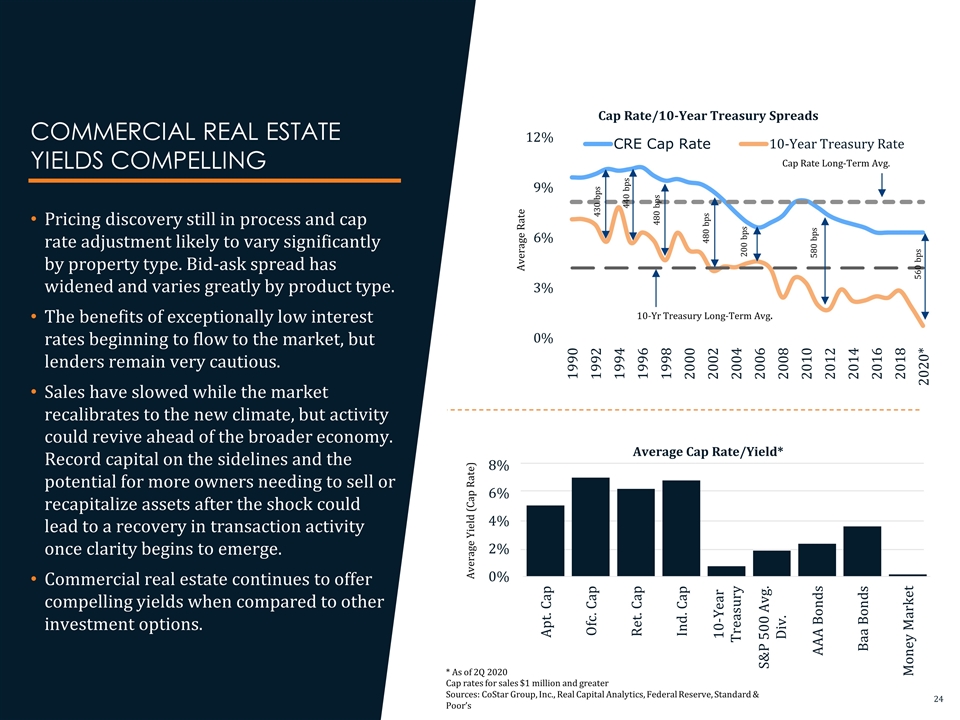
Average Rate Average Yield (Cap Rate) 430 bps 440 bps 480 bps 480 bps 200 bps 580 bps 560 bps Cap Rate Long-Term Avg. 10-Yr Treasury Long-Term Avg. * As of 2Q 2020 Cap rates for sales $1 million and greater Sources: CoStar Group, Inc., Real Capital Analytics, Federal Reserve, Standard & Poor’s COMMERCIAL REAL ESTATE YIELDS COMPELLING Pricing discovery still in process and cap rate adjustment likely to vary significantly by property type. Bid-ask spread has widened and varies greatly by product type. The benefits of exceptionally low interest rates beginning to flow to the market, but lenders remain very cautious. Sales have slowed while the market recalibrates to the new climate, but activity could revive ahead of the broader economy. Record capital on the sidelines and the potential for more owners needing to sell or recapitalize assets after the shock could lead to a recovery in transaction activity once clarity begins to emerge. Commercial real estate continues to offer compelling yields when compared to other investment options. Average Cap Rate/Yield* Cap Rate/10-Year Treasury Spreads

MMI FINANCIAL SUMMARY
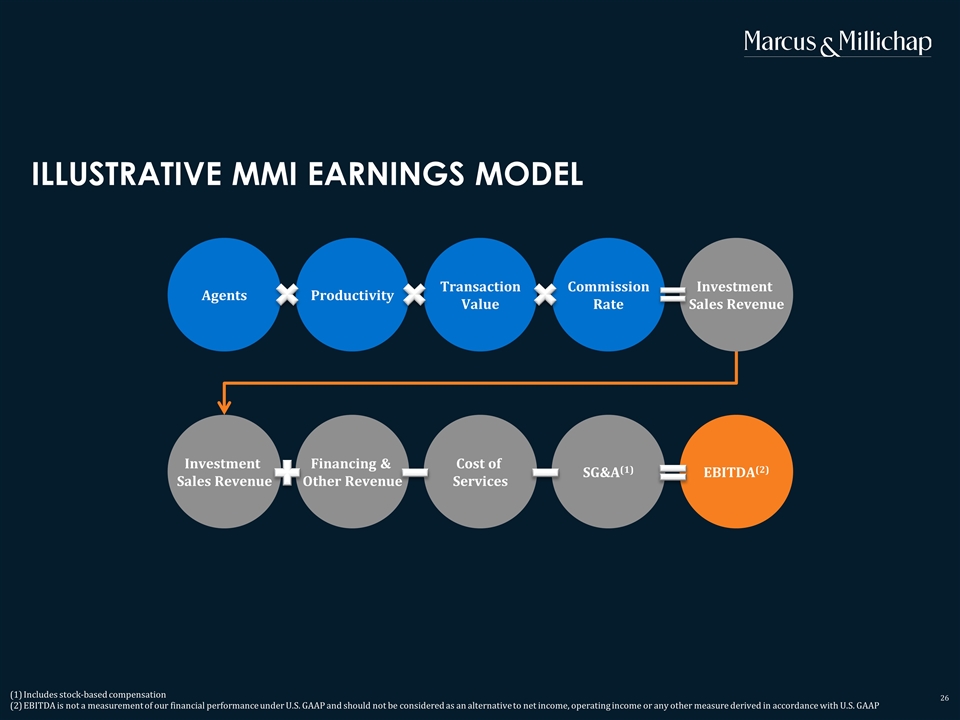
ILLUSTRATIVE MMI EARNINGS MODEL Includes stock-based compensation EBITDA is not a measurement of our financial performance under U.S. GAAP and should not be considered as an alternative to net income, operating income or any other measure derived in accordance with U.S. GAAP Investment Sales Revenue Commission Rate Transaction Value Productivity Agents EBITDA(2) Investment Sales Revenue Financing & Other Revenue Cost of Services SG&A(1)
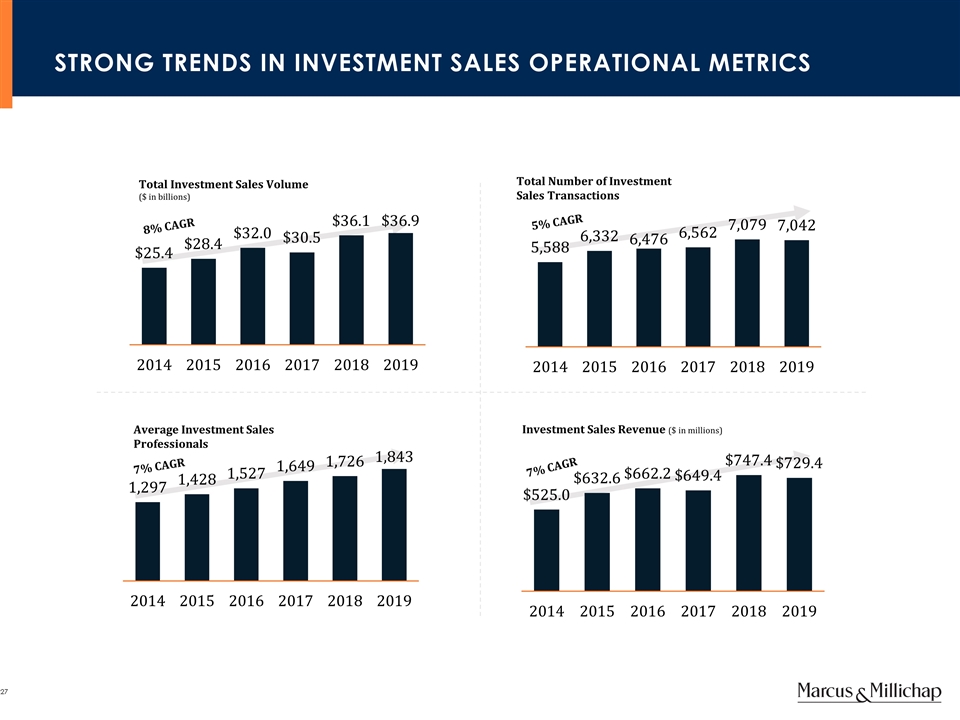
STRONG TRENDS IN INVESTMENT SALES OPERATIONAL METRICS Average Investment Sales Professionals 8% CAGR Total Investment Sales Volume ($ in billions) Total Number of Investment Sales Transactions Investment Sales Revenue ($ in millions) 7% CAGR 5% CAGR 7% CAGR
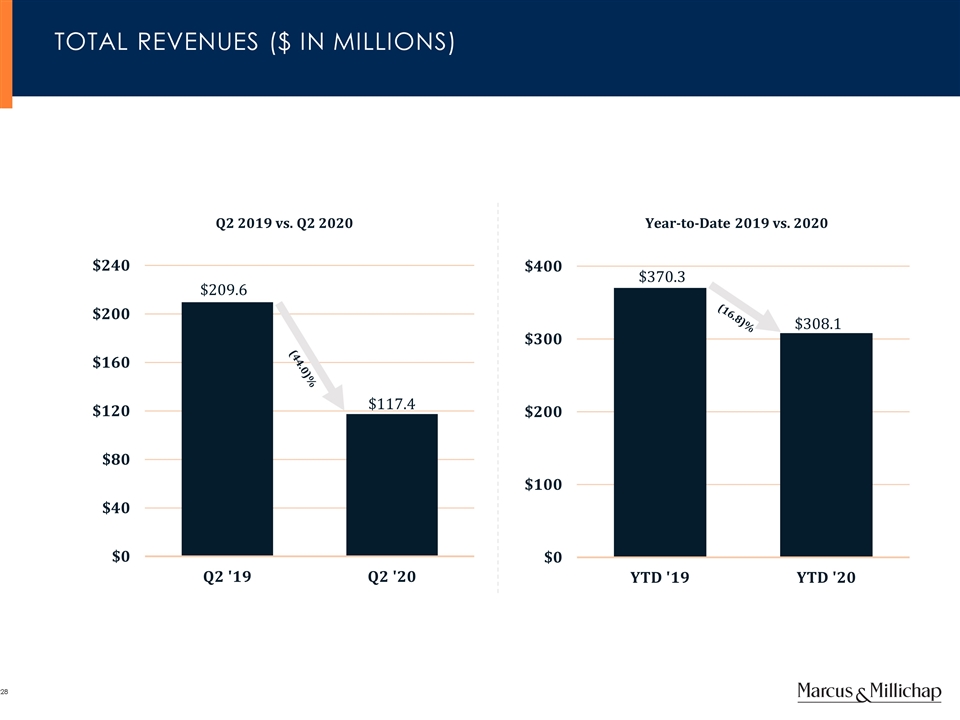
TOTAL REVENUES ($ in millions) (44.0)% (16.8)% Q2 2019 vs. Q2 2020 Year-to-Date 2019 vs. 2020
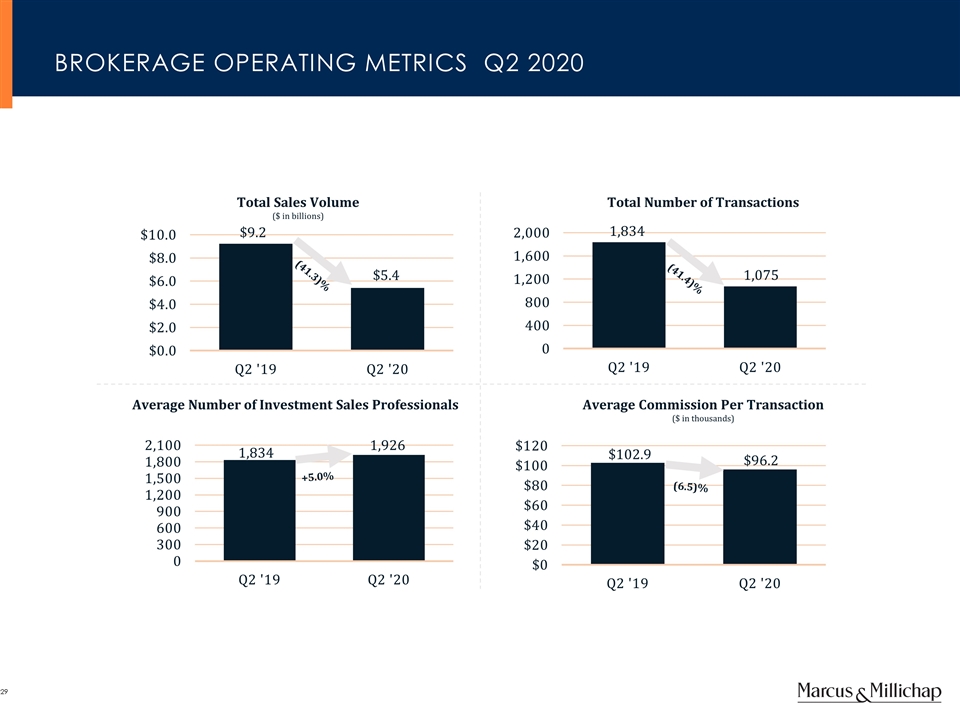
Total Sales Volume ($ in billions) Total Number of Transactions Average Number of Investment Sales Professionals Average Commission Per Transaction ($ in thousands) (41.3)% (41.4)% +5.0% (6.5)% BROKERAGE OPERATING METRICS Q2 2020
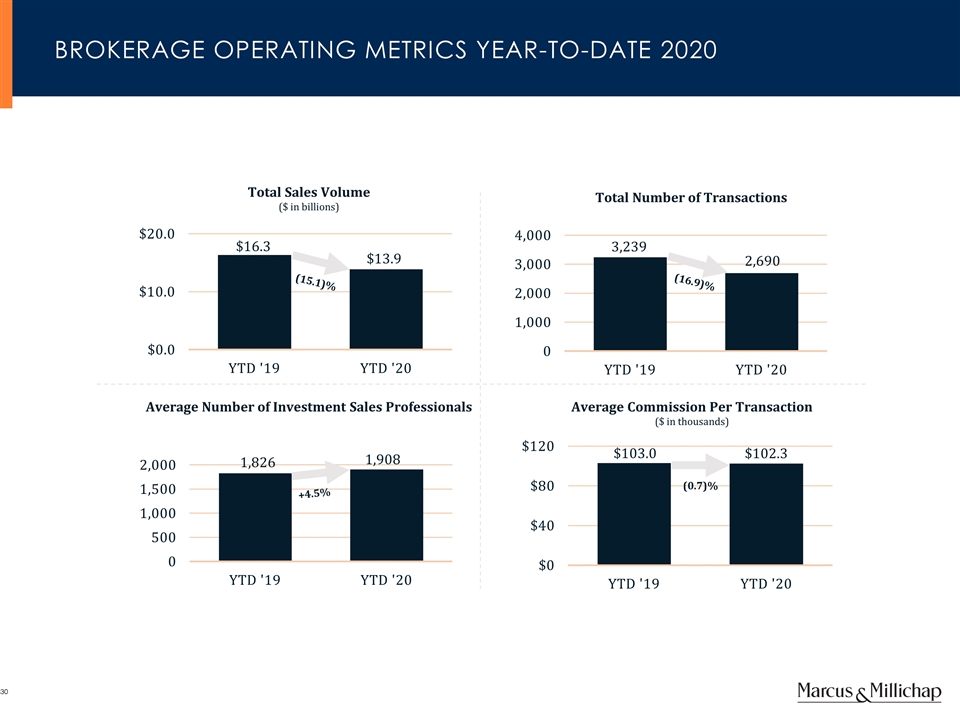
Total Sales Volume ($ in billions) Total Number of Transactions Average Number of Investment Sales Professionals Average Commission Per Transaction ($ in thousands) (15.1)% (16.9)% +4.5% BROKERAGE OPERATING METRICS Year-to-Date 2020 (0.7)%
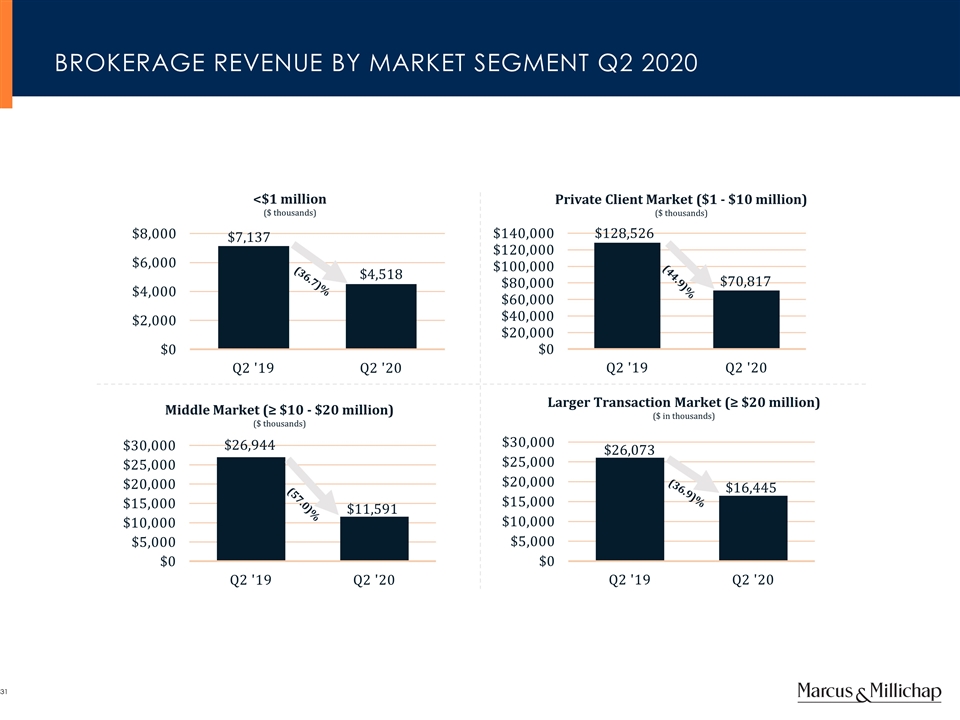
Private Client Market ($1 - $10 million) ($ thousands) <$1 million ($ thousands) Middle Market (≥ $10 - $20 million) ($ thousands) Larger Transaction Market (≥ $20 million) ($ in thousands) (36.7)% (44.9)% (36.9)% BROKERAGE REVENUE BY MARKET SEGMENT Q2 2020 (57.0)%
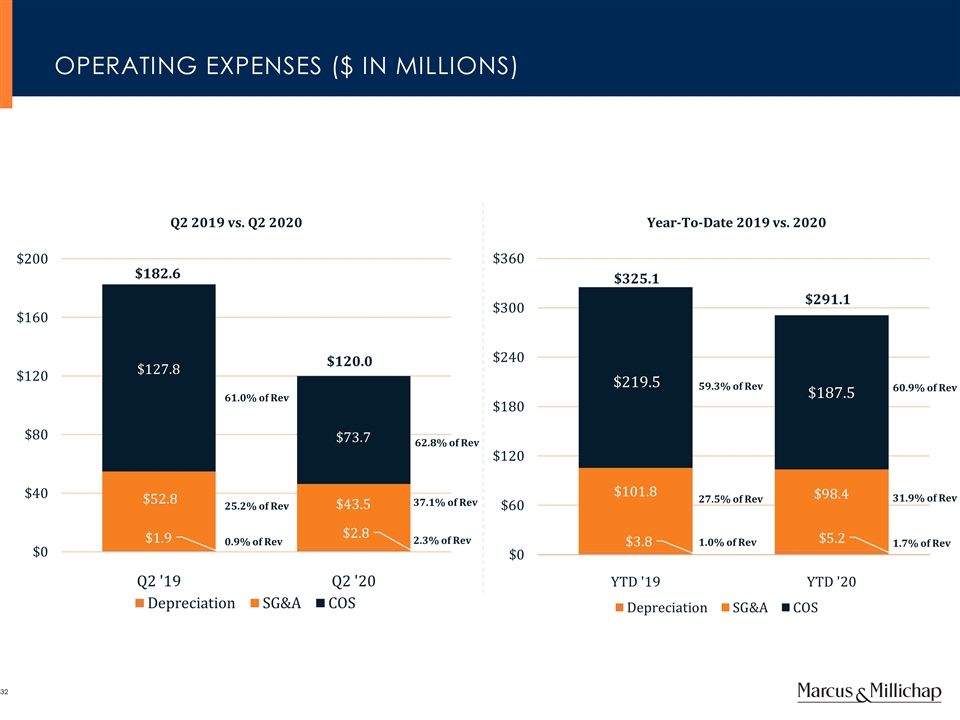
59.3% of Rev 1.0% of Rev 1.7% of Rev $325.1 $291.1 27.5% of Rev OPERATING EXPENSES ($ in Millions) 61.0% of Rev 0.9% of Rev 2.3% of Rev $182.6 $120.0 25.2% of Rev Q2 2019 vs. Q2 2020 Year-To-Date 2019 vs. 2020 60.9% of Rev 31.9% of Rev 62.8% of Rev 37.1% of Rev
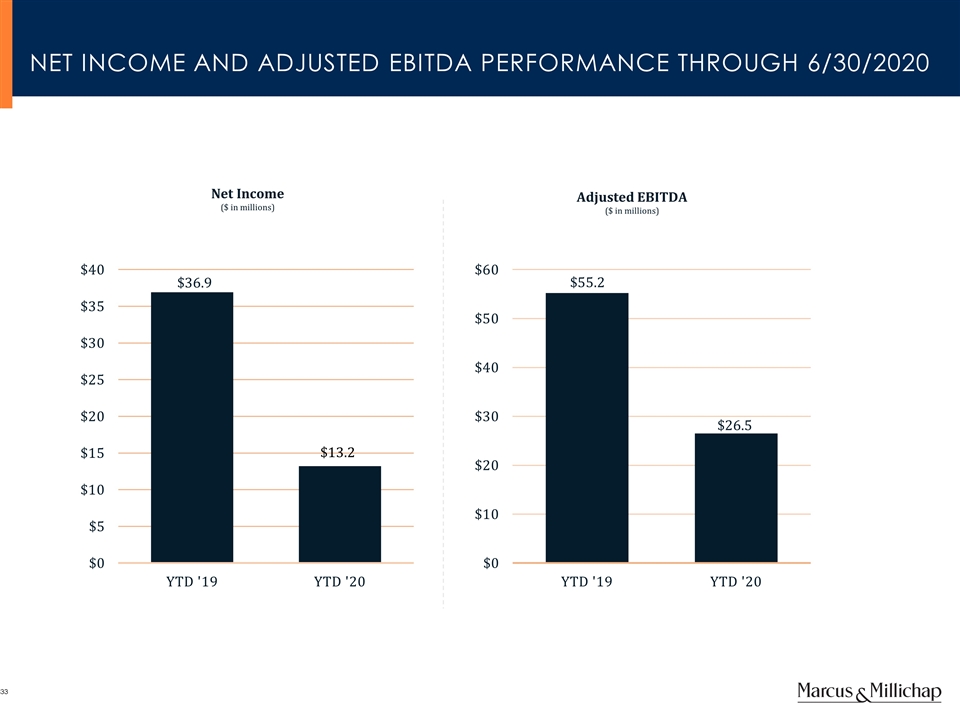
Adjusted EBITDA ($ in millions) Net Income ($ in millions) NET INCOME AND ADJUSTED EBITDA PERFORMANCE Through 6/30/2020
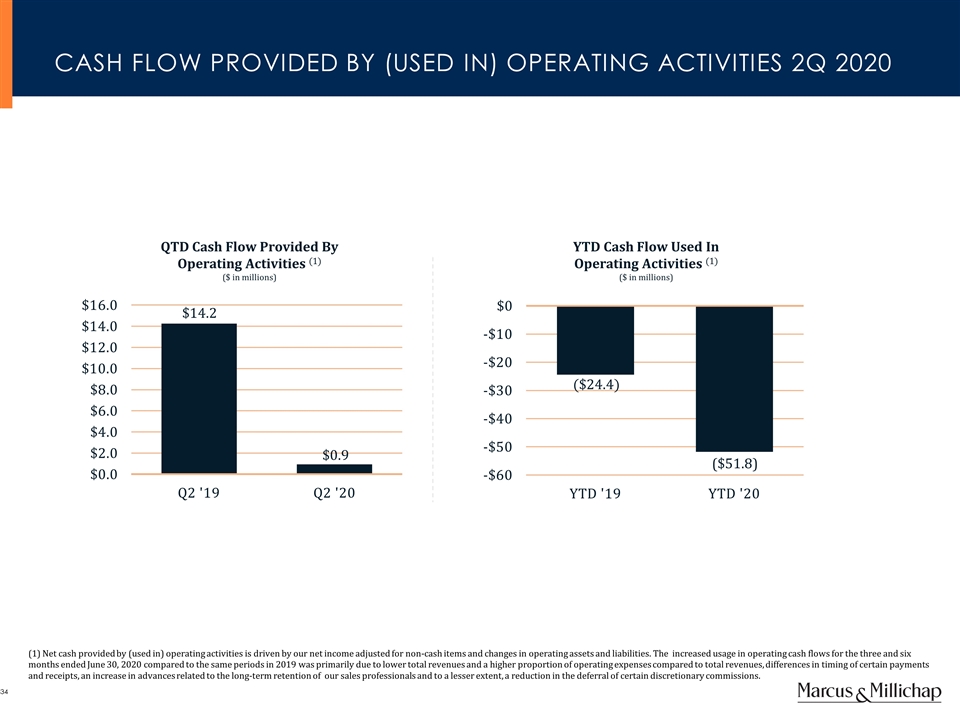
QTD Cash Flow Provided By Operating Activities (1) ($ in millions) YTD Cash Flow Used In Operating Activities (1) ($ in millions) CASH FLOW PROVIDED BY (USED IN) OPERATING ACTIVITIES 2Q 2020 (1) Net cash provided by (used in) operating activities is driven by our net income adjusted for non-cash items and changes in operating assets and liabilities. The increased usage in operating cash flows for the three and six months ended June 30, 2020 compared to the same periods in 2019 was primarily due to lower total revenues and a higher proportion of operating expenses compared to total revenues, differences in timing of certain payments and receipts, an increase in advances related to the long-term retention of our sales professionals and to a lesser extent, a reduction in the deferral of certain discretionary commissions.
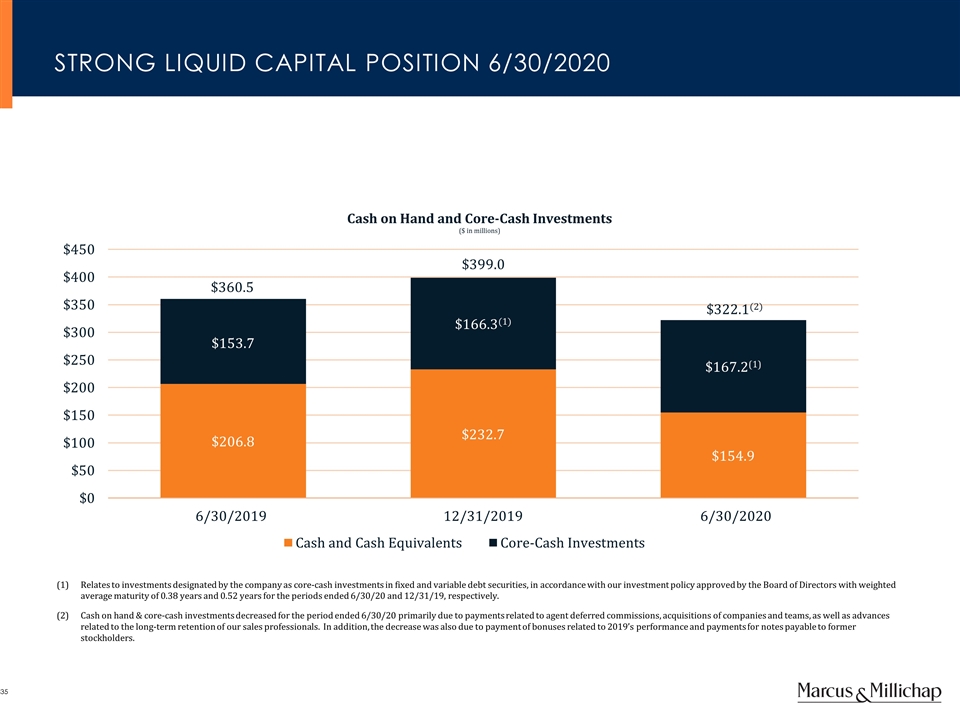
Cash on Hand and Core-Cash Investments ($ in millions) $399.0 $322.1(2) STRONG LIQUID CAPITAL POSITION 6/30/2020 12/31/2019 6/30/2020 Relates to investments designated by the company as core-cash investments in fixed and variable debt securities, in accordance with our investment policy approved by the Board of Directors with weighted average maturity of 0.38 years and 0.52 years for the periods ended 6/30/20 and 12/31/19, respectively. Cash on hand & core-cash investments decreased for the period ended 6/30/20 primarily due to payments related to agent deferred commissions, acquisitions of companies and teams, as well as advances related to the long-term retention of our sales professionals. In addition, the decrease was also due to payment of bonuses related to 2019’s performance and payments for notes payable to former stockholders.

APPENDIX
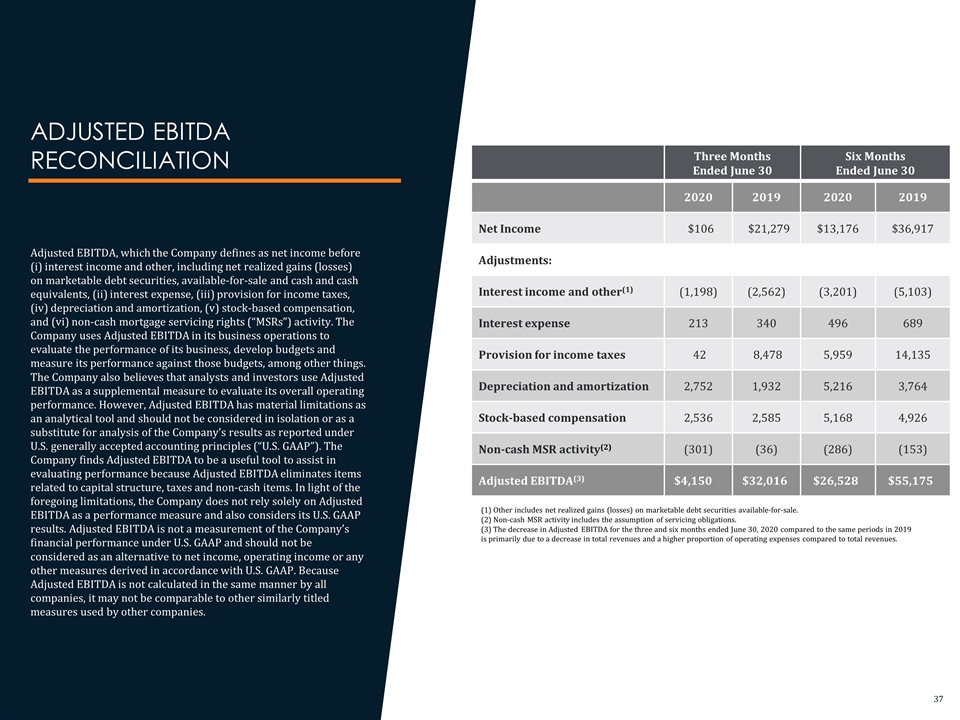
ADJUSTED EBITDA RECONCILIATION Adjusted EBITDA, which the Company defines as net income before (i) interest income and other, including net realized gains (losses) on marketable debt securities, available-for-sale and cash and cash equivalents, (ii) interest expense, (iii) provision for income taxes, (iv) depreciation and amortization, (v) stock-based compensation, and (vi) non-cash mortgage servicing rights (“MSRs”) activity. The Company uses Adjusted EBITDA in its business operations to evaluate the performance of its business, develop budgets and measure its performance against those budgets, among other things. The Company also believes that analysts and investors use Adjusted EBITDA as a supplemental measure to evaluate its overall operating performance. However, Adjusted EBITDA has material limitations as an analytical tool and should not be considered in isolation or as a substitute for analysis of the Company’s results as reported under U.S. generally accepted accounting principles (“U.S. GAAP”). The Company finds Adjusted EBITDA to be a useful tool to assist in evaluating performance because Adjusted EBITDA eliminates items related to capital structure, taxes and non-cash items. In light of the foregoing limitations, the Company does not rely solely on Adjusted EBITDA as a performance measure and also considers its U.S. GAAP results. Adjusted EBITDA is not a measurement of the Company’s financial performance under U.S. GAAP and should not be considered as an alternative to net income, operating income or any other measures derived in accordance with U.S. GAAP. Because Adjusted EBITDA is not calculated in the same manner by all companies, it may not be comparable to other similarly titled measures used by other companies. Three Months Ended June 30 Six Months Ended June 30 2020 2019 2020 2019 Net Income $106 $21,279 $13,176 $36,917 Adjustments: Interest income and other(1) (1,198) (2,562) (3,201) (5,103) Interest expense 213 340 496 689 Provision for income taxes 42 8,478 5,959 14,135 Depreciation and amortization 2,752 1,932 5,216 3,764 Stock-based compensation 2,536 2,585 5,168 4,926 Non-cash MSR activity(2) (301) (36) (286) (153) Adjusted EBITDA(3) $4,150 $32,016 $26,528 $55,175 (1) Other includes net realized gains (losses) on marketable debt securities available-for-sale. (2) Non-cash MSR activity includes the assumption of servicing obligations. (3) The decrease in Adjusted EBITDA for the three and six months ended June 30, 2020 compared to the same periods in 2019 is primarily due to a decrease in total revenues and a higher proportion of operating expenses compared to total revenues.